GE 2007 Annual Report Download - page 84
Download and view the complete annual report
Please find page 84 of the 2007 GE annual report below. You can navigate through the pages in the report by either clicking on the pages listed below, or by using the keyword search tool below to find specific information within the annual report.-
 1
1 -
2
-
3
-
4
-
5
-
6
-
7
-
8
-
9
-
10
-
11
-
12
-
13
-
14
-
15
-
16
-
17
-
18
-
19
-
20
-
21
-
22
-
23
-
24
-
25
-
26
-
27
-
28
-
29
-
30
-
31
-
32
-
33
-
34
-
35
-
36
-
37
-
38
-
39
-
40
-
41
-
42
-
43
-
44
-
45
-
46
-
47
-
48
-
49
-
50
-
51
-
52
-
53
-
54
-
55
-
56
-
57
-
58
-
59
-
60
-
61
-
62
-
63
-
64
-
65
-
66
-
67
-
68
-
69
-
70
-
71
-
72
-
73
-
 74
74 -
 75
75 -
 76
76 -
 77
77 -
 78
78 -
 79
79 -
 80
80 -
 81
81 -
 82
82 -
 83
83 -
 84
84 -
 85
85 -
 86
86 -
 87
87 -
 88
88 -
 89
89 -
 90
90 -
 91
91 -
 92
92 -
 93
93 -
 94
94 -
95
-
96
-
97
-
98
-
99
-
100
-
101
-
102
-
103
-
104
-
105
-
106
-
107
-
108
-
109
-
110
-
111
-
112
-
113
-
114
-
115
-
116
-
117
-
118
-
119
-
120
 |
 |

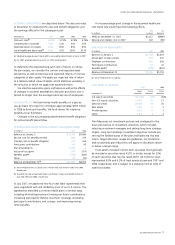
82 ge 2007 annual report
RECONCILIATION OF U.S. FEDERAL STATUTORY INCOME TAX RATE TO ACTUAL INCOME TAX RATE
Consolidated GE GECS
2007 2006 2005 2007 2006 2005 2007 2006 2005
U.S. federal statutory income tax rate 35.0% 35.0% 35.0% 35.0% 35.0% 35.0% 35.0% 35.0% 35.0%
Increase (reduction) in rate resulting from
Inclusion of after-tax earnings of GECS
in before-tax earnings of GE — — — (17.2) (16.4) (15.7) — — —
Tax on global activities including exports
(15.7) (16.7) (15.4) (5.0) (6.5) (5.0) (21.2) (21.1) (22.2)
U.S. business credits (1.1) (1.4) (1.4) (0.3) (0.4) (0.2) (1.5) (2.2) (2.7)
SES transaction
(2.1) — — — — — (4.0) — —
All other — net (0.6) — (0.1) (1.4) (0.1) (0.7) 1.4 0.3 1.2
(19.5) (18.1) (16.9) (23.9) (23.4) (21.6) (25.3) (23.0) (23.7)
Actual income tax rate
15.5% 16.9% 18.1% 11.1% 11.6% 13.4% 9.7% 12.0% 11.3%
A reconciliation of the beginning and ending amounts of unrec-
ognized tax benefi ts is as follows:
(In millions) 2007
Balance at January 1, 2007 $ 6,806
Additions for tax positions of the current year 434
Additions for tax positions of prior years 1,439
Reductions for tax positions of prior years (1,939)
Settlements with tax authorities (330)
Expiration of the statute of limitations (79)
Balance at December 31, 2007 $ 6,331
We classify interest on tax defi ciencies as interest expense;
we classify income tax penalties as provision for income taxes.
For the year ended December 31, 2007, $(279) million of interest
expense and $(34) million of tax expense related to penalties
were recognized in the statement of operations.
A reconciliation of the U.S. federal statutory income tax rate
to the actual income tax rate is provided below.
Note 8
Earnings Per Share Information
2007 2006 2005
(In millions; per-share amounts in dollars) Diluted Basic Diluted Basic Diluted Basic
CONSOLIDATED
Earnings from continuing operations for per-share calculation
(a) $22,468 $22,468 $19,382 $19,380 $17,355 $17,354
Earnings (loss) from discontinued operations for per-share
calculation
(b) (260) (260) 1,362 1,362 (645) (634)
Net earnings available for per-share calculation 22,208 22,208 20,744 20,742 16,709 16,720
AVERAGE EQUIVALENT SHARES
Shares of GE common stock outstanding 10,182 10,182 10,359 10,359 10,570 10,570
Employee compensation-related shares, including stock options 36 — 35 — 41 —
Total average equivalent shares
10,218 10,182 10,394 10,359 10,611 10,570
PER-SHARE AMOUNTS
Earnings from continuing operations $ 2.20 $ 2.21 $ 1.86 $ 1.87 $ 1.64 $ 1.64
Earnings (loss) from discontinued operations (0.03) (0.03) 0.13 0.13 (0.06) (0.06)
Net earnings per share 2.17 2.18 2.00 2.00 1.57 1.58
(a) Included dividend equivalents of approximately $1 million in each of the three years ended December 31, 2007.
(b) Included dilutive effects of subsidiary-issued stock-based awards of approximately $11 million in 2005.
Earnings-per-share amounts are computed independently
for earnings from continuing operations, earnings (loss) from
discontinued operations and net earnings. As a result, the
sum of per-share amounts from continuing operations and
discontinued operations may not equal the total per-share
amounts for net earnings.