GE 2007 Annual Report Download - page 80
Download and view the complete annual report
Please find page 80 of the 2007 GE annual report below. You can navigate through the pages in the report by either clicking on the pages listed below, or by using the keyword search tool below to find specific information within the annual report.-
 1
1 -
2
-
3
-
4
-
5
-
6
-
7
-
8
-
9
-
10
-
11
-
12
-
13
-
14
-
15
-
16
-
17
-
18
-
19
-
20
-
21
-
22
-
23
-
24
-
25
-
26
-
27
-
28
-
29
-
30
-
31
-
32
-
33
-
34
-
35
-
36
-
37
-
38
-
39
-
40
-
41
-
42
-
43
-
44
-
45
-
46
-
47
-
48
-
49
-
50
-
51
-
52
-
53
-
54
-
55
-
56
-
57
-
58
-
59
-
60
-
61
-
62
-
63
-
64
-
65
-
66
-
67
-
68
-
69
-
 70
70 -
 71
71 -
 72
72 -
 73
73 -
 74
74 -
 75
75 -
 76
76 -
 77
77 -
 78
78 -
 79
79 -
 80
80 -
 81
81 -
 82
82 -
 83
83 -
 84
84 -
 85
85 -
 86
86 -
 87
87 -
 88
88 -
 89
89 -
 90
90 -
91
-
92
-
93
-
94
-
95
-
96
-
97
-
98
-
99
-
100
-
101
-
102
-
103
-
104
-
105
-
106
-
107
-
108
-
109
-
110
-
111
-
112
-
113
-
114
-
115
-
116
-
117
-
118
-
119
-
120
 |
 |

78 ge 2007 annual report
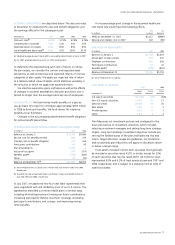
COST OF PENSION PLANS
Total
Principal pension plans
Other pension plans
(In millions) 2007 2006 2005 2007 2006 2005 2007 2006 2005
Expected return on plan assets $(4,459) $(4,211) $(4,242) $(3,950) $(3,811) $(3,885) $(509) $(400) $(357)
Service cost for benefi ts earned 1,727 1,719 1,618 1,355 1,402 1,359 372 317 259
Interest cost on benefi t obligation 2,885 2,685 2,609 2,416 2,304 2,248 469 381 361
Prior service cost amortization 247 258 262 241 253 256 6 5 6
Net actuarial loss amortization 856 893 480 693 729 351 163 164 129
Pension plans cost
$ 1,256 $ 1,344 $ 727 $ 755 $ 877 $ 329 $ 501 $ 467 $ 398
RETIREE BENEFIT ASSET (LIABILITY)
December 31 (In millions) 2007 2006
Funded status (a) $(11,179) $(6,552)
Liability recorded in the Statement of
Financial Position
Retiree health plans
Due within one year
$ (675) $ (681)
Due after one year (10,172) (5,320)
Retiree life plans (332) (551)
Net liability recognized
$(11,179) $(6,552)
Amounts recorded in shareowners’ equity
Prior service cost
$ 5,700 $ 2,046
Net actuarial loss 210 4
Total
$ 5,910 $ 2,050
(a) Fair value of assets less APBO, as shown in the preceding tables.
In 2008, we estimate that we will amortize $675 million of prior
service cost and $40 million of net actuarial loss from shareown-
ers’ equity into retiree benefi t plans cost. Comparable amortized
amounts in 2007 were $603 million cost and $17 million cost
reduction, respectively.
ESTIMATED FUTURE BENEFIT PAYMENTS
2013–
(In millions) 2008 2009 2010 2011 2012 2017
Gross $935 $990 $1,050 $1,105 $1,115 $5,850
Expected Medicare
Part D subsidy 85 90 100 105 115 675
Net $850 $900 $ 950 $1,000 $1,000 $5,175
Pension benefits
We sponsor a number of pension plans. Principal pension plans,
together with affi liate and certain other pension plans (other
pension plans) detailed in this note, represent about 99% of our
total pension assets. We use a December 31 measurement date
for our plans.
PRINCIPAL PENSION PLANS are the GE Pension Plan and the GE
Supplementary Pension Plan.
The GE Pension Plan provides benefi ts to certain U.S. employees
based on the greater of a formula recognizing career earnings or
a formula recognizing length of service and fi nal average earnings.
Certain benefi t provisions are subject to collective bargaining.
The GE Supplementary Pension Plan is an unfunded plan
providing supplementary retirement benefi ts primarily to higher-
level, longer-service U.S. employees.
OTHER PENSION PLANS in 2007 included 29 U.S. and non-U.S.
pension plans with pension assets or obligations greater than
$50 million. These defi ned benefi t plans provide benefi ts to
employees based on formulas recognizing length of service
and earnings.
PENSION PLAN PARTICIPANTS
Principal Other
pension pension
December 31, 2007 Total plans plans
Active employees 182,000 135,000 47,000
Vested former employees 234,000 195,000 39,000
Retirees and benefi ciaries 235,000 210,000 25,000
Total 651,000 540,000 111,000
Principal pension plans Other pension plans (weighted average)
December 31 2007 2006 2005 2004 2007 2006 2005 2004
Discount rate 6.34% 5.75% 5.50% 5.75% 5.65% 4.97% 4.74% 5.28%
Compensation increases 5.00 5.00 5.00 5.00 4.50 4.26 4.20 4.03
Expected return on assets 8.50 8.50 8.50 8.50 7.51 7.44 7.47 7.67
ACTUARIAL ASSUMPTIONS are described below. The discount rates
at December 31 measured the year-end benefi t obligations and
the earnings effects for the subsequent year.