GE 2007 Annual Report Download - page 7
Download and view the complete annual report
Please find page 7 of the 2007 GE annual report below. You can navigate through the pages in the report by either clicking on the pages listed below, or by using the keyword search tool below to find specific information within the annual report.-
 1
1 -
 2
2 -
 3
3 -
 4
4 -
 5
5 -
 6
6 -
 7
7 -
 8
8 -
 9
9 -
 10
10 -
 11
11 -
 12
12 -
 13
13 -
 14
14 -
 15
15 -
 16
16 -
 17
17 -
 18
18 -
19
-
20
-
21
-
22
-
23
-
24
-
25
-
26
-
27
-
28
-
29
-
30
-
31
-
32
-
33
-
34
-
35
-
36
-
37
-
38
-
39
-
40
-
41
-
42
-
43
-
44
-
45
-
46
-
47
-
48
-
49
-
50
-
51
-
52
-
53
-
54
-
55
-
56
-
57
-
58
-
59
-
60
-
61
-
62
-
63
-
64
-
65
-
66
-
67
-
68
-
69
-
70
-
71
-
72
-
73
-
74
-
75
-
76
-
77
-
78
-
79
-
80
-
81
-
82
-
83
-
84
-
85
-
86
-
87
-
88
-
89
-
90
-
91
-
92
-
93
-
94
-
95
-
96
-
97
-
98
-
99
-
100
-
101
-
102
-
103
-
104
-
105
-
106
-
107
-
108
-
109
-
110
-
111
-
112
-
113
-
114
-
115
-
116
-
117
-
118
-
119
-
120
 |
 |

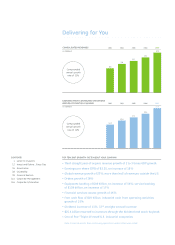
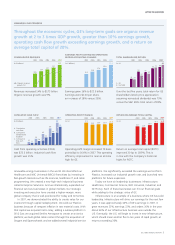
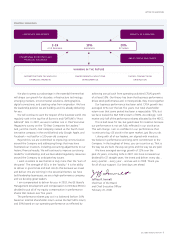
MEASURING OUR PROGRESS
Throughout the economic cycles, GE’s long-term goals are organic revenue
growth at 2 to 3 times GDP growth, greater than 10% earnings growth,
operating cash fl ow growth exceeding earnings growth, and a return on
average total capital of 20%.
Revenues increased 14% to $173 billion.
Organic revenue growth was 9%.
Earnings grew 16% to $22.5 billion.
Earnings were $2.20 per share,
an increase of 18% versus 2006.
Over the last fi ve years, total return for GE
shareholders (stock price appreciation
assuming reinvested dividends) was 75%
versus the S&P 500’s total return of 83%.
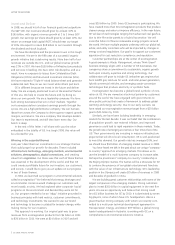
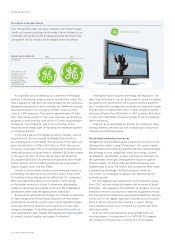
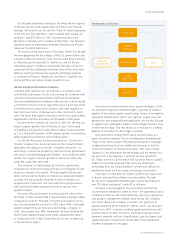
renewable-energy businesses in the world. We diversifi ed our
Healthcare and NBC Universal (NBCU) franchises by investing in
fast-growth markets such as life sciences, healthcare IT, and cable
programming. We created a new high-tech industrial business
called Enterprise Solutions. And we dramatically expanded our
fi nancial services businesses in global markets. Our strategic
investing and execution have created a higher-margin, more
global company that is well-positioned for today and tomorrow.
In 2007, we demonstrated the ability to create value for our
investors through capital redeployment. We sold our Plastics
business because of rampant infl ation in raw material costs. With
that capital we acquired Vetco Gray, adding a subsea platform in
Oil & Gas; we acquired Smiths Aerospace to create an avionics
platform; we built global cable content through the acquisition of
Oxygen and Sparrowhawk; and we added several industrial service
platforms. We signifi cantly exceeded the earnings we lost from
Plastics, increased our industrial growth rate, and launched new
platforms for future expansion.
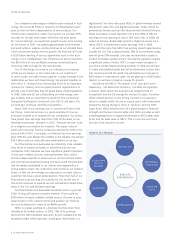
Today we have six leadership businesses: Infrastructure,
Healthcare, Commercial Finance, NBC Universal, Industrial, and
GE Money. Each of these businesses can hit our fi nancial goals
while adding to the strategic value of GE.
Infrastructure is an example of a business where GE has solid
leadership. Infrastructure will drive our earnings for the next few
years. It was approximately 40% of GE’s earnings in 2007. It
grew revenues 23%, earnings 22%, and orders 26% in the year.
About 60% of our Infrastructure business was outside the
U.S. Eventually, the U.S. will begin to invest in new infrastructure,
which should mean another fi ve to ten years of rapid growth, at
returns exceeding 30%.
152
137
124
105
2003 2004 2005 2006 2007
173
CONSOLIDATED REVENUES
(In $ billions)
9
8
6
-1
9
Organic revenue
growth (%)
19.4
17.4
15.6
13.3
2003 2004 2005 2006 2007
22.5
EARNINGS FROM CONTINUING OPERATIONS
BEFORE ACCOUNTING CHANGES
(In $ billions)
TOTAL SHAREHOLDER RETURN
A. GE
B. S&P 500
2003 2004 2005 2006 2007
70 73
56 50
58
43
31 29
75
83
(In %)
Cash from operating activities (CFOA)
was $23.5 billion. Industrial cash fl ow
growth was 15%.
Operating profi t margin increased 70 basis
points (bp) to 16.6% in 2007. This operating
effi ciency improvement is near an all-time
high for GE.
Return on average total capital (ROTC)
improved 30 bp to 18.9%. This is
in line with the Company’s historical
highs for ROTC.
CUMULATIVE CASH FLOW
A. Cumulative
cash flow
B. Cumulative
dividend and
buyback
C. Cumulative
free cash
flow
2003 2004 2005 2006 2007
69
49
45
31
25
16
12 8
92
32
18
8
2
51
75
(In $ billions) 15.9
15.9
15.5
17.1
2003 2004 2005 2006 2007
16.6
OPERATING PROFIT MARGIN
(In %) 18.6
16.8
14.9
15.7
2003 2004 2005 2006 2007
18.9
RETURN ON AVERAGE TOTAL CAPITAL
(In %)
ge 2007 annual report 5