GE 2007 Annual Report Download - page 82
Download and view the complete annual report
Please find page 82 of the 2007 GE annual report below. You can navigate through the pages in the report by either clicking on the pages listed below, or by using the keyword search tool below to find specific information within the annual report.-
 1
1 -
2
-
3
-
4
-
5
-
6
-
7
-
8
-
9
-
10
-
11
-
12
-
13
-
14
-
15
-
16
-
17
-
18
-
19
-
20
-
21
-
22
-
23
-
24
-
25
-
26
-
27
-
28
-
29
-
30
-
31
-
32
-
33
-
34
-
35
-
36
-
37
-
38
-
39
-
40
-
41
-
42
-
43
-
44
-
45
-
46
-
47
-
48
-
49
-
50
-
51
-
52
-
53
-
54
-
55
-
56
-
57
-
58
-
59
-
60
-
61
-
62
-
63
-
64
-
65
-
66
-
67
-
68
-
69
-
70
-
71
-
 72
72 -
 73
73 -
 74
74 -
 75
75 -
 76
76 -
 77
77 -
 78
78 -
 79
79 -
 80
80 -
 81
81 -
 82
82 -
 83
83 -
 84
84 -
 85
85 -
 86
86 -
 87
87 -
 88
88 -
 89
89 -
 90
90 -
 91
91 -
 92
92 -
93
-
94
-
95
-
96
-
97
-
98
-
99
-
100
-
101
-
102
-
103
-
104
-
105
-
106
-
107
-
108
-
109
-
110
-
111
-
112
-
113
-
114
-
115
-
116
-
117
-
118
-
119
-
120
 |
 |

80 ge 2007 annual report
• Real estate investments may not exceed 25% of total assets.
• Investments in restricted securities that are not freely tradable
may not exceed 20% of total assets (actual was 15% of trust
assets at December 31, 2007).
• GE stock is subject to a statutory limit at 10% of total trust
assets (actual was 5.6% and 6.1% at the end of 2007 and
2006, respectively).
At December 31, 2007, GE Pension Trust assets included exposure
to $975 million of subprime residential mortgage-backed securi-
ties. A majority of these assets have received credit ratings of
Double A or better from the major rating agencies. Our subprime
investment securities were collateralized primarily by pools of
individual, direct mortgage loans, not other structured products
such as collateralized debt obligations.
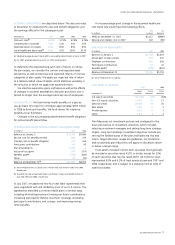
Other pension plans (weighted average)
2007 2006
Target Actual Actual
December 31 allocation allocation allocation
Equity securities 65% 67% 67%
Debt securities 28 25 26
Real estate 4 4 3
Other 3 4 4
PENSION ASSET (LIABILITY)
Principal pension plans Other pension plans
December 31 (In millions) 2007 2006 2007 2006
Funded status
(a) $16,753 $11,465 $(1,603) $(2,599)
Pension asset (liability)
recorded in the Statement
of Financial Position
Pension asset
$20,190 $15,019 $ 258 $ 46
Unfunded liabilities
Due within one year
(b) (111) (106) (54) (49)
Due after one year
(b) (3,326) (3,448) (1,807) (2,596)
Net amount recognized
$16,753 $11,465 $(1,603) $(2,599)
Amounts recorded in
shareowners’ equity
Prior service cost
$ 2,060 $ 831 $ 65 $ 15
Net actuarial loss (gain) (4,974) 2,162 654 1,704
Total
$ (2,914) $ 2,993 $ 719 $ 1,719
(a) Fair value of assets less PBO, as shown in the preceding tables.
(b) For principal pension plans, represents the GE Supplementary Pension Plan liability.
In 2008, we estimate that we will amortize $325 million of prior
service cost and $225 million of net actuarial loss for the princi-
pal pension plans from shareowners’ equity into pension cost.
For other pension plans, the estimated prior service cost and
net actuarial loss to be amortized over the next fi scal year are
$10 million and $70 million, respectively. Comparable amortized
amounts in 2007, respectively, were $241 million and $693 million
for principal pension plans and $6 million and $163 million for
other pension plans.
ESTIMATED FUTURE BENEFIT PAYMENTS
2013–
(In millions) 2008 2009 2010 2011 2012 2017
Principal pension
plans $2,650 $2,700 $2,750 $2,850 $2,900 $15,600
Other pension
plans 335 345 350 350 375 2,025
Postretirement benefit plans
2007 COST OF POSTRETIREMENT BENEFIT PLANS AND CHANGES
IN EQUITY OTHER THAN TRANSACTIONS WITH SHAREOWNERS
Total Retiree Principal Other
postretirement benefit pension pension
(In millions) benefit plans plans plans plans
Cost of postretirement
benefi t plans $ 2,580 $1,324 $ 755 $ 501
Changes in equity other
than transactions with
shareowners
Net actuarial loss
(gain) — current year $(7,111) $ 189 $(6,443) $ (857)
Prior service cost —
current year 5,753 4,257 1,470 26
Prior service cost
amortization (850) (603) (241) (6)
Net actuarial gain
(loss) amortization (839) 17 (693) (163)
Total changes in equity
other than transactions
with shareowners (3,047) 3,860 (5,907) (1,000)
Cost of postretirement
benefi t plans and
changes in equity
other than transactions
with shareowners $ (467) $5,184 $(5,152) $ (499)
Note 7
Provision for Income Taxes
(In millions) 2007 2006 2005
GE
Current tax expense $2,230 $1,849 $ 2,797
Deferred tax expense (benefi t)
from temporary differences 564 703 (119)
2,794 2,552 2,678
GECS
Current tax expense 1,277 391 2,090
Deferred tax expense (benefi t)
from temporary differences 59 1,007 (944)
1,336 1,398 1,146
CONSOLIDATED
Current tax expense 3,507 2,240 4,887
Deferred tax expense (benefi t)
from temporary differences 623 1,710 (1,063)
Total
$4,130 $3,950 $ 3,824