GE 2007 Annual Report Download - page 88
Download and view the complete annual report
Please find page 88 of the 2007 GE annual report below. You can navigate through the pages in the report by either clicking on the pages listed below, or by using the keyword search tool below to find specific information within the annual report.-
 1
1 -
2
-
3
-
4
-
5
-
6
-
7
-
8
-
9
-
10
-
11
-
12
-
13
-
14
-
15
-
16
-
17
-
18
-
19
-
20
-
21
-
22
-
23
-
24
-
25
-
26
-
27
-
28
-
29
-
30
-
31
-
32
-
33
-
34
-
35
-
36
-
37
-
38
-
39
-
40
-
41
-
42
-
43
-
44
-
45
-
46
-
47
-
48
-
49
-
50
-
51
-
52
-
53
-
54
-
55
-
56
-
57
-
58
-
59
-
60
-
61
-
62
-
63
-
64
-
65
-
66
-
67
-
68
-
69
-
70
-
71
-
72
-
73
-
74
-
75
-
76
-
77
-
 78
78 -
 79
79 -
 80
80 -
 81
81 -
 82
82 -
 83
83 -
 84
84 -
 85
85 -
 86
86 -
 87
87 -
 88
88 -
 89
89 -
 90
90 -
 91
91 -
 92
92 -
 93
93 -
 94
94 -
 95
95 -
 96
96 -
 97
97 -
 98
98 -
99
-
100
-
101
-
102
-
103
-
104
-
105
-
106
-
107
-
108
-
109
-
110
-
111
-
112
-
113
-
114
-
115
-
116
-
117
-
118
-
119
-
120
 |
 |

86 ge 2007 annual report
Investment in fi nancing leases consists of direct fi nancing and
leveraged leases of aircraft, railroad rolling stock, autos, other
transportation equipment, data processing equipment, medical
equipment, commercial real estate and other manufacturing,
power generation, and commercial equipment and facilities.
For federal income tax purposes, the leveraged leases and the
majority of the direct fi nancing leases are leases in which GECS
depreciates the leased assets and is taxed upon the accrual of
rental income. Certain direct fi nancing leases are loans for federal
income tax purposes in which GECS is taxable only on the portion
of each payment that constitutes interest, unless the interest is
tax-exempt (e.g., certain obligations of state governments).
Investment in direct fi nancing and leveraged leases represents
net unpaid rentals and estimated unguaranteed residual values of
leased equipment, less related deferred income. GECS has no
general obligation for principal and interest on notes and other
instruments representing third-party participation related to
leveraged leases; such notes and other instruments have not
been included in liabilities but have been offset against the
related rentals receivable. The GECS share of rentals receivable on
leveraged leases is subordinate to the share of other participants
who also have security interests in the leased equipment.
For federal income tax purposes, GECS is entitled to deduct
the interest expense accruing on nonrecourse fi nancing related
to leveraged leases.
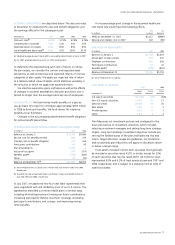
NET INVESTMENT IN FINANCING LEASES
Total financing leases Direct financing leases
(a) Leveraged leases
(b)
December 31 (In millions) 2007 2006 2007 2006 2007 2006
Total minimum lease payments receivable $ 92,137 $ 88,598 $ 72,399 $64,637 $ 19,738 $ 23,961
Less principal and interest on third-party nonrecourse debt (14,102) (17,309) — — (14,102) (17,309)
Net rentals receivable
78,035 71,289 72,399 64,637 5,636 6,652
Estimated unguaranteed residual value of leased assets 10,306 10,062 7,500 7,068 2,806 2,994
Less deferred income (13,326) (12,782) (10,650) (9,634) (2,676) (3,148)
Investment in fi nancing leases, net of deferred income
75,015 68,569 69,249 62,071 5,766 6,498
Less amounts to arrive at net investment
Allowance for losses (571) (392) (559) (370) (12) (22)
Deferred taxes (7,089) (8,314) (2,654) (3,410) (4,435) (4,904)
Net investment in fi nancing leases
$ 67,355 $ 59,863 $ 66,036 $58,291 $ 1,319 $ 1,572
(a) Included $802 million and $665 million of initial direct costs on direct fi nancing leases at December 31, 2007 and 2006, respectively.
(b) Included pre-tax income of $412 million and $306 million and income tax of $156 million and $115 million during 2007 and 2006, respectively. Net investment credits recog-
nized on leveraged leases during 2007 and 2006 were inconsequential.
CONTRACTUAL MATURITIES
Net rentals
(In millions) Total loans receivable
Due in
2008 $ 94,720 $22,455
2009 36,401 15,534
2010 28,258 12,057
2011 21,267 8,778
2012 19,364 5,435
2013 and later 114,908 13,776
Total $314,918 $78,035
We expect actual maturities to differ from contractual maturities.
Individually “impaired” loans are defi ned by GAAP as larger
balance or restructured loans for which it is probable that the
lender will be unable to collect all amounts due according to
original contractual terms of the loan agreement. An analysis of
impaired loans follows.
December 31 (In millions)
2007 2006
Loans requiring allowance for losses $1,004 $1,147
Loans expected to be fully recoverable 391 497
$1,395 $1,644
Allowance for losses
$ 366 $ 393
Average investment during year 1,594 1,687
Interest income earned while impaired
(a) 19 34
(a) Recognized principally on cash basis.