Lowe's 1997 Annual Report Download - page 14
Download and view the complete annual report
Please find page 14 of the 1997 Lowe's annual report below. You can navigate through the pages in the report by either clicking on the pages listed below, or by using the keyword search tool below to find specific information within the annual report.-
 1
1 -
2
-
3
-
 4
4 -
 5
5 -
 6
6 -
 7
7 -
 8
8 -
 9
9 -
 10
10 -
 11
11 -
 12
12 -
 13
13 -
 14
14 -
 15
15 -
 16
16 -
 17
17 -
 18
18 -
 19
19 -
 20
20 -
 21
21 -
 22
22 -
 23
23 -
 24
24 -
25
-
26
-
27
-
28
-
29
-
30
-
31
-
32
-
33
-
34
-
35
-
36
-
37
-
38
-
39
-
40
 |
 |

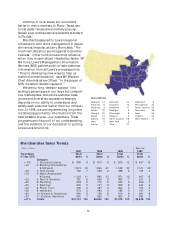
Lowe’s Stores
Alabama 17 Kentucky 20 Oklahoma 9
Arkansas 8 Louisiana 13 Pennsylvania 20
Delaware 3 Maryland 11 South Carolina 25
Florida 20 Michigan 8 Tennessee 28
Georgia 22 Mississippi 8 Texas 36
Illinois 12 Missouri 5 Virginia 35
Indiana 18 North Carolina 68 West Virginia 12
Iowa 5 New York 5
Kansas 1 Ohio 37
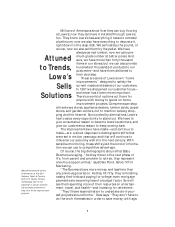
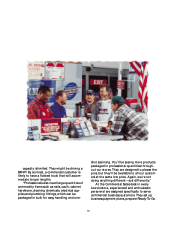
common in rural areas, but wood sells
better in metro markets. In Plano, Texas, sec-
tional cedar fences are extremely popular.
Screen pool enclosures have become standard
in Florida.”
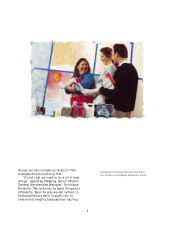
Merchants assigned to Lowe’s regional
offices work with store management in expan-
sion areas, because, as Larry Stone says, “ Too
much centralization works against local effec-
tiveness.” Other functions are most effective
when they’re centralized. Headed by Senior VP
Bill Irons, Lowe’s Management Information
Services (MIS) gathers point-of-sale customer
information from all Lowe’s compass points.
“ They’re developing new ways to help us
make informed decisions,” says Bill Warden,
Chief Administrative Officer. “ In the jargon of
MIS, it’s called ‘decision support.’”
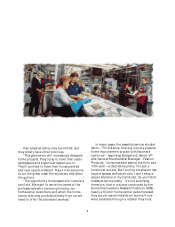
We are turning ‘decision support’ into
strategic advantages in our large but competi-
tive marketplace. As Lowe’s customer base
grows and diversifies, success increasingly
depends on our ability to understand and
satisfy each customer better than our competi-
tion. In 1998, we are implementing long-term
initiatives supported by information from the
best possible source—our customers. These
programs are the proof of our understanding,
and the evidence of our dedication to putting
Lowe’s customers first.
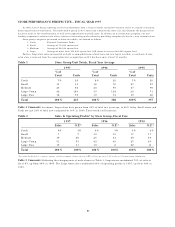
Merchandise Sales Trends
Dollars in Millions Base Year
1997 1996 1995 1992
Total Sales Total Total Total Total
5-Year CGR Sales % Sales % Sales % Sales %
Category
+ 8% 1. Structural Lumber $ 939 9 $ 815 9 $ 839 12 $ 637 16
+12 2. Building Commodities
& Millwork 1,974 19 1,866 21 1,508 22 1,101 29
+36 3. Home Decor 700 7 528 6 388 5 149 4
+19 4. Major Appliances/
Kitchens 1,102 11 992 12 871 12 457 12
+32 5. Paint & Sundries 791 8 645 8 493 7 201 5
+29 6. Plumbing 938 9 776 9 607 9 266 7
+30 7. Electrical 879 9 707 8 559 8 240 6
+32 8. Power Tools 609 6 487 6 364 5 154 4
+28 9. Hardware 572 6 493 6 386 5 167 4
+26 10. Nursery & Gardening 942 9 728 8 610 9 291 8
+30 11. Outdoor Hardlines 691 7 563 7 450 6 183 5
+21% Totals $10,137 100 $8,600 100 $7,075 100 $3,846 100
12