Lowe's 1997 Annual Report Download - page 38
Download and view the complete annual report
Please find page 38 of the 1997 Lowe's annual report below. You can navigate through the pages in the report by either clicking on the pages listed below, or by using the keyword search tool below to find specific information within the annual report.-
 1
1 -
2
-
3
-
4
-
5
-
6
-
7
-
8
-
9
-
10
-
11
-
12
-
13
-
14
-
15
-
16
-
17
-
18
-
19
-
20
-
21
-
22
-
23
-
24
-
25
-
26
-
27
-
 28
28 -
 29
29 -
 30
30 -
 31
31 -
 32
32 -
 33
33 -
 34
34 -
 35
35 -
 36
36 -
 37
37 -
 38
38 -
 39
39 -
 40
40
 |
 |
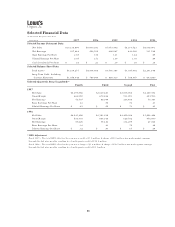
Financial History
Supplemental Information LIFO accounting
5-Year January 30, January 31, January 31, January 31, January 31,
Fiscal Years Ended on CGR 1998 1997 1996 1995 1994
Stores and People
1 Number of Stores 8.0% 446 402 365 336 311
2 Square Footage 29.7 36,545,343 30,381,529 23,945,111 18,604,368 14,174,889
3 Number of Employees 20.3 58,504 53,492 44,546 37,555 28,843
4 Customer Transactions (Thousands) 20.7% 206,498 176,206 146,957 122,847 92,932
5 Average Purchase $49.09 $48.81 $48.15 $49.74 $48.83
Comparative Income Statements (Thousands)
6 Sales 21.4% $10,136,890 $8,600,241 $7,075,442 $6,110,521 $4,538,001
7 Depreciation 28.1 240,880 198,115 150,011 109,647 80,530
8 LIFO Credit (Charge) NM 7,000 (1,390) (8,250) (435) (15,524)
9 Operating Income132.6 864,994 700,788 540,158 481,051 297,132
10 Pre-Tax Earnings 34.7 558,547 453,606 352,107 343,531 198,324
11 Income Tax Provision NM 201,063 161,456 126,080 119,971 66,538
12 Net Earnings 33.4 357,484 292,150 226,027 223,560 131,786
13 Cash Dividends 12.6 38,239 34,709 30,471 27,433 23,571
14 Earnings Retained NM $ 319,245 $ 257,441 $ 195,556 $ 196,127 $ 107,731
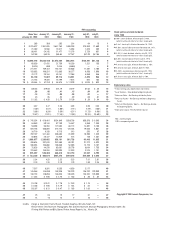
Dollars Per Share (Weighted Average Number of Shares)
15 Sales 17.2% $58.13 $51.29 $44.10 $39.44 $30.79
16 Diluted Earnings 28.7 2.05 1.71 1.36 1.39 .89
17 Cash Dividends 9.5 .22 .21 .19 .18 .16
18 Earnings Retained NM 1.83 1.54 1.22 1.27 .73
19 Shareholders’ Equity 24.3% $14.91 $13.22 $10.33 $ 9.16 $ 5.93
Financial Ratios
20 Asset Turnover22.29 2.42 2.28 2.78 2.82
21 Return on Sales33.53% 3.40% 3.19% 3.66% 2.90%
22 Return on Assets48.06% 8.21% 7.28% 10.15% 8.19%
23 Return on Shareholders’ Equity516.12% 17.63% 15.92% 25.59% 17.97%
Comparative Balance Sheets (Thousands)
24 Total Current Assets 23.1% $2,109,602 $1,851,466 $1,603,684 $1,557,168 $1,083,907
25 Cash and Short-Term Investments 31.0 211,301 70,490 171,297 268,474 108,468
26 Accounts Receivable — Net 17.3 118,408 117,562 113,483 109,214 48,500
27 Inventories (Lower of Cost or Market) 25.6 1,714,592 1,605,880 1,267,077 1,132,282 853,707
28 Other Current Assets (2.1) 31,185 37,682 32,659 29,069 60,932
29 Fixed Assets 30.7 3,005,199 2,494,396 1,858,274 1,397,713 1,020,234
30 Other Assets 5.6 69,315 53,477 53,369 67,652 57,099
31 Total Assets 26.5 5,219,277 4,434,954 3,556,386 3,105,992 2,201,648
32 Total Current Liabilities 23.7 1,449,320 1,348,531 949,931 945,893 681,176
33 Accounts Payable 24.0 969,777 914,167 655,399 675,436 467,278
34 Other Current Liabilities 24.9 220,915 198,461 151,494 134,334 81,765
35 Long-Term Debt (Excluding Current Maturities) 27.2 1,045,570 767,338 866,183 681,184 592,333
36 Total Liabilities 24.5 2,618,668 2,217,478 1,899,671 1,686,102 1,327,979
37 Shareholders’ Equity 28.8% $2,600,609 $2,217,476 $1,656,715 $1,419,890 $ 873,669
38 Equity/Long-Term Debt
(Excluding Current Maturities)
2.49 2.89 1.91 2.08 1.47
39 Year-End Leverage Factor: Assets/Equity 2.01 2.00 2.15 2.19 2.52
Shareholders, Shares and Book Value
40 Shareholders of Record, Year-End 11,334 11,460 11,299 9,765 7,470
41 Shares Outstanding, Year-End (Thousands) 175,316 173,404 160,918 159,527 147,886
42 Weighted Average Shares, Assuming Dilution (Thousands) 174,380 172,684 171,351 165,921 147,398
43 Book Value Per Share $14.83 $12.79 $10.30 $ 8.90 $ 5.91
Closing Stock Price During Calendar Year6
44 High (Adjusted for Stock Splits) $49.13 $43.50 $38.88 $41.38 $31.00
45 Low (Adjusted for Stock Splits) $31.63 $28.63 $26.00 $27.75 $13.32
46 Closing Price as of December 31 $47.69 $35.63 $33.50 $34.75 $29.75
Price/Earnings Ratio
47 High 24 25 29 30 35
48 Low 15 17 19 20 15
36