Lowe's 1997 Annual Report Download - page 27
Download and view the complete annual report
Please find page 27 of the 1997 Lowe's annual report below. You can navigate through the pages in the report by either clicking on the pages listed below, or by using the keyword search tool below to find specific information within the annual report.-
 1
1 -
2
-
3
-
4
-
5
-
6
-
7
-
8
-
9
-
10
-
11
-
12
-
13
-
14
-
15
-
16
-
 17
17 -
 18
18 -
 19
19 -
 20
20 -
 21
21 -
 22
22 -
 23
23 -
 24
24 -
 25
25 -
 26
26 -
 27
27 -
 28
28 -
 29
29 -
 30
30 -
 31
31 -
 32
32 -
 33
33 -
 34
34 -
 35
35 -
 36
36 -
 37
37 -
38
-
39
-
40
 |
 |
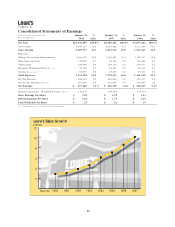
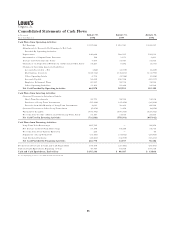
Consolidated Statements of Cash Flows
In Thousands
Fiscal Years Ended on
January 30, January 31, January 31,
1998 1997 1996
Cash Flows from Operating Activities:
Net Earnings $ 357,484 $ 292,150 $ 226,027
Adjustments to Reconcile Net Earnings to Net Cash
Provided By Operating Activities:
Depreciation 240,880 198,115 150,011
Amortization of Original Issue Discount 192 1,671 3,601
Increase in Deferred Income Taxes 7,637 17,043 32,924
(Gain) Loss on Disposition/Writedown of Fixed and Other Assets 14,263 9,892 (1,171)
Changes in Operating Assets and Liabilities:
Accounts Receivable – Net (846) (4,079) (4,269)
Merchandise Inventory (108,712) (338,803) (134,795)
Other Operating Assets 6,732 (4,788) (3,298)
Accounts Payable 55,610 258,768 (20,037)
Employee Retirement Plans 60,527 59,736 38,196
Other Operating Liabilities 31,103 53,288 16,120
Net Cash Provided by Operating Activities 664,870 542,993 303,309
Cash Flows from Investing Activities:
(Increase) Decrease in Investment Assets:
Short-Term Investments 25,773 98,754 18,538
Purchases of Long-Term Investments (15,384) (27,259) (30,906)
Proceeds from Sale/Maturity of Long-Term Investments 4,811 12,203 66,588
(Increase) Decrease in Other Long-Term Assets (5,472) 3,456 (2,656)
Fixed Assets Acquired (772,792) (677,160) (520,362)
Proceeds from the Sale of Fixed and Other Long-Term Assets 31,183 11,615 20,856
Net Cash Used in Investing Activities (731,881) (578,391) (447,942)
Cash Flows from Financing Activities:
Long-Term Debt Borrowings 265,795 — 98,959
Net Increase in Short-Term Borrowings 17,199 64,288 14,714
Proceeds from Stock Options Exercised 210 — 44
Repayment of Long-Term Debt (32,781) (17,662) (25,064)
Cash Dividend Payments (28,653) (34,709) (30,471)
Net Cash Provided by Financing Activities 221,770 11,917 58,182
Net Increase (Decrease) in Cash and Cash Equivalents 154,759 (23,481) (86,451)
Cash and Cash Equivalents, Beginning of Year 40,387 63,868 150,319
Cash and Cash Equivalents, End of Year $ 195,146 $ 40,387 $ 63,868
See accompanying notes to consolidated financial statements.
25