Lowe's 1997 Annual Report Download - page 20
Download and view the complete annual report
Please find page 20 of the 1997 Lowe's annual report below. You can navigate through the pages in the report by either clicking on the pages listed below, or by using the keyword search tool below to find specific information within the annual report.-
 1
1 -
2
-
3
-
4
-
5
-
6
-
7
-
8
-
9
-
 10
10 -
 11
11 -
 12
12 -
 13
13 -
 14
14 -
 15
15 -
 16
16 -
 17
17 -
 18
18 -
 19
19 -
 20
20 -
 21
21 -
 22
22 -
 23
23 -
 24
24 -
 25
25 -
 26
26 -
 27
27 -
 28
28 -
 29
29 -
 30
30 -
31
-
32
-
33
-
34
-
35
-
36
-
37
-
38
-
39
-
40
 |
 |
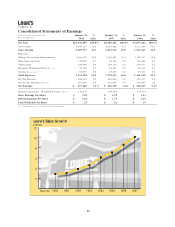
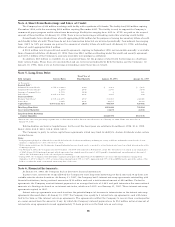
Management’s Discussion and Analysis of Financial Condition and Results of Operations
This discussion summarizes the significant factors affecting the Company’s consolidated operating results and liquidity
and capital resources during the three-year period ended January 30, 1998 (i.e., fiscal 1997, 1996 and 1995). This discus-
sion should be read in conjunction with the Letter to Shareholders, financial statements and financial statement footnotes
included in this annual report.
Net earnings for 1997 increased 22% to $357.5 million or 3.5% of sales compared to $292.2 million or 3.4% of sales
for 1996. Return on beginning assets was 8.1% compared to 8.2% for 1996; and return on beginning shareholders’
equity was 16.1% compared to 17.6% for 1996. This decrease in return on equity resulted primarily from an increase in
equity during 1996 due to the conversion of outstanding convertible debt to common stock.
OPERATIONS
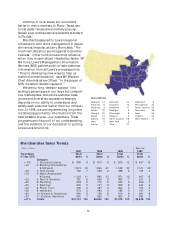
The Company’s sales were $10.1 billion during 1997, an 18% increase over 1996 sales of $8.6 billion. Sales for 1996
were 22% higher than 1995 levels. Comparable store sales increased 4% in 1997. Large store (stores exceeding 80,000
square feet) comparable sales increased 6% for the year. The increases in sales are attributable to the Company’s store
expansion and relocation program and comparable store sales growth. Comparable store sales increases are driven by the
Company’s continued strategy of employing an expanded inventory assortment, everyday competitive prices and an
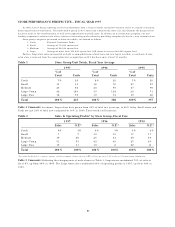
emphasis on customer service. The following table presents sales and store information:
Fiscal
1997 1996 1995
Sales (in millions) $10,137 $8,600 $7,075
Sales Increases 18% 22% 16%
Comparable Store Sales Increases 4% 7% —
At end of year:
Stores 446 402 365
Sales Floor Square Feet (in millions) 36.5 30.4 24.0
Average Store Size Square Feet (in thousands) 82 76 66
Gross margin in 1997 increased to 26.5% from 25.9% in 1996. Both of these years were an improvement over the
24.9% posted in 1995. Adherence to careful pricing disciplines in the execution of the Company’s everyday competitive
pricing strategy continued to provide margin improvements. Also, changes in product mix resulting from the expanded
merchandise selection available in larger stores has contributed to the improvements in gross margin. Additionally, the
Company reduced its exposure in lower margin consumer electronics at the end of 1995 replacing these items with less
seasonal, stronger margin products. The Company recorded a LIFO credit of $7.0 million in 1997, compared to charges
of $1.4 million and $8.3 million for 1996 and 1995, increasing gross margin for 1997 by 6 basis points, and decreasing
gross margin for 1996 and 1995 by 1 and 12 basis points, respectively.
Selling, General and Administrative (SG&A) expenses for 1997 were $1.7 billion or 16.6% of sales. SG&A in the two
previous years was 16.2% and 15.9% of sales. The 1997 increase of 40 basis points primarily resulted from higher
payroll levels at stores that were new or relocated and increased costs relating to relocating or closing stores. The 1996
increase of 30 basis points primarily resulted from higher payroll levels at new or relocated stores and from the full achieve-
ment of annual bonus performance goals by management in 1996 compared to partial achievement in 1995. The Company
has completed a comprehensive analysis of the impact and costs relating to the year 2000 system conversions and has
developed an implementation plan to address the issue. The impact of the conversions is not expected to have a signifi-
cant effect on the Company’s results of operations and the related costs are not estimated to be material.
Store opening costs were $70.0 million for 1997. These costs were $59.2 and $49.6 million for 1996 and 1995,
respectively, and were expensed as incurred. As a percentage of sales, store opening costs were 0.7% for each of the three
years presented. These costs averaged approximately $1 million per store during 1997.
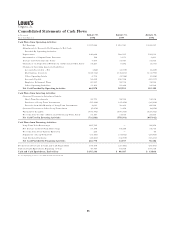
Depreciation, reflecting continued fixed asset expansion, increased 22% to $241 million, compared to increases of
32% and 37% for 1996 and 1995, respectively. Depreciation as a percentage of sales increased slightly to 2.4% in 1997
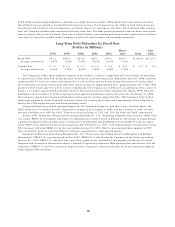
from 2.3% in 1996 and 2.1% in 1995. Approximately 43% of new stores opened in the last three years were leased, of
which approximately 30%, 93% and 64% in 1997, 1996 and 1995 were under capital leases. Property, less accumulated
depreciation, increased to $3.01 billion at January 30, 1998 compared to $2.49 billion at January 31, 1997. The increase
in property resulted primarily from the Company’s expansion program, including land, building, store equipment,
fixtures and displays and investment in new distribution facilities.
Employee retirement plan expense for 1997 was $72 million or 0.7% to sales. This cost is consistent with 0.8% for
1996 and 0.7% for 1995.
18