Lowe's 1997 Annual Report Download - page 23
Download and view the complete annual report
Please find page 23 of the 1997 Lowe's annual report below. You can navigate through the pages in the report by either clicking on the pages listed below, or by using the keyword search tool below to find specific information within the annual report.-
 1
1 -
2
-
3
-
4
-
5
-
6
-
7
-
8
-
9
-
10
-
11
-
12
-
 13
13 -
 14
14 -
 15
15 -
 16
16 -
 17
17 -
 18
18 -
 19
19 -
 20
20 -
 21
21 -
 22
22 -
 23
23 -
 24
24 -
 25
25 -
 26
26 -
 27
27 -
 28
28 -
 29
29 -
 30
30 -
 31
31 -
 32
32 -
 33
33 -
34
-
35
-
36
-
37
-
38
-
39
-
40
 |
 |

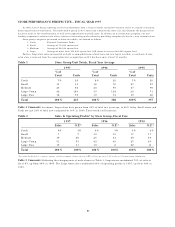
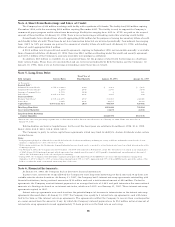
STORE PERFORMANCE PERSPECTIVE – FISCAL YEAR 1997
In 1992, Lowe’s began reporting on the transformation from a chain of small, contractor-oriented stores to a family of modern,
home-improvement warehouses. The tables below group Lowe’s stores into categories by store size and illustrate the progress that
has been made in the transformation as well as the opportunity that still exists. In addition to our relocation program, our new
territory expansion continues and offers a means of increasing market share by providing exceptional value to a new customer base.
Store group categories, presented in these two tables, are defined as follows:
1. Yards : Focused Contractor Yards
2. Small : Average of 19,000 square feet
3. Medium : Average of 58,000 square feet
4. Large : Average of more than 100,000 square feet. (All stores in excess of 80,000 square feet.)
Further, Large store sales are reported on both a comparable (same store) basis and new (open less than a year) basis. A relo-
cated store is removed from the comparable store computation until it has been open at least 13 months.
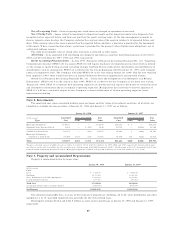
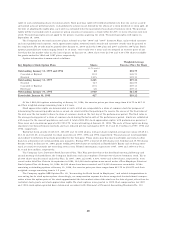
Table 1 Store Group Unit Totals, Fiscal Year Average
Table 1 Comments: As shown, Large stores have grown from 39% of total two years ago, to 60% today. Small stores and
Yards are just 20% of total now compared to 34% in 1995. These trends will continue.
Table 2 Sales & Operating Profits* by Store Group, Fiscal Year
*Operating Profits before corporate expense and intercompany charges, interest, LIFO and income taxes. 1995 is also net of restructuring adjustments.
Table 2 Comments: Reflecting the changing mix of units shown in Table 1, Large stores contributed 70% of sales in
fiscal ’97, up from 49% in 1995. The Large stores also contributed 64% of operating profits in 1997, up from 40% in
1995.
1997 1996 1995
% of % of % of
Total Units Total Units Total Units
Yards 7% 29 6% 25 7% 25
Small 13 55 18 70 27 97
Medium 20 84 24 95 27 96
Large Comp 42 180 33 124 20 71
Large New 18 75 19 74 19 68
Total 100% 423 100% 388 100% 357
1997 1996 1995
Sales O.P.* Sales O.P.* Sales O.P.*
Yards 4% 3% 4% 3% 5% 4%
Small 7 7 10 10 17 17
Medium 19 26 25 34 29 39
Large Comp 51 53 42 45 27 29
Large New 19 11 19 8 22 11
Total 100% 100% 100% 100% 100% 100%
21