Lowe's 1997 Annual Report Download - page 24
Download and view the complete annual report
Please find page 24 of the 1997 Lowe's annual report below. You can navigate through the pages in the report by either clicking on the pages listed below, or by using the keyword search tool below to find specific information within the annual report.-
 1
1 -
2
-
3
-
4
-
5
-
6
-
7
-
8
-
9
-
10
-
11
-
12
-
13
-
 14
14 -
 15
15 -
 16
16 -
 17
17 -
 18
18 -
 19
19 -
 20
20 -
 21
21 -
 22
22 -
 23
23 -
 24
24 -
 25
25 -
 26
26 -
 27
27 -
 28
28 -
 29
29 -
 30
30 -
 31
31 -
 32
32 -
 33
33 -
 34
34 -
35
-
36
-
37
-
38
-
39
-
40
 |
 |
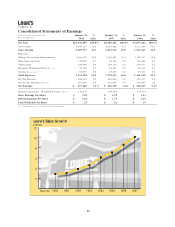
January 30, % January 31, % January 31, %
1998 Sales 1997 Sales 1996 Sales
Consolidated Statements of Earnings
In Thousands, Except Per Share Data
Fiscal Years Ended On
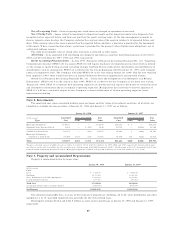
Net Sales $10,136,890 100.0% $8,600,241 100.0% $7,075,442 100.0%
Cost of Sales 7,447,117 73.5 6,376,482 74.1 5,312,195 75.1
Gross Margin 2,689,773 26.5 2,223,759 25.9 1,763,247 24.9
Expenses:
Selling, General and Administrative 1,683,000 16.6 1,395,523 16.2 1,127,333 15.9
Store Opening Costs 69,999 0.7 59,159 0.7 49,626 0.7
Depreciation 240,880 2.4 198,115 2.3 150,011 2.1
Employee Retirement Plans (Note 10) 71,780 0.7 68,289 0.8 46,130 0.7
Interest (Notes 6 and 13) 65,567 0.6 49,067 0.6 38,040 0.5
Total Expenses 2,131,226 21.0 1,770,153 20.6 1,411,140 19.9
Pre-Tax Earnings 558,547 5.5 453,606 5.3 352,107 5.0
Income Tax Provision (Note 11) 201,063 2.0 161,456 1.9 126,080 1.8
Net Earnings $ 357,484 3.5% $ 292,150 3.4% $ 226,027 3.2%
Shares Outstanding – Weighted Average (Note 7) 174,277 167,599 160,377
Basic Earnings Per Share $ 2.05 $ 1.74 $ 1.41
Diluted Earnings Per Share $ 2.05 $ 1.71 $ 1.36
Cash Dividends Per Share $ .22 $ .21 $ .19
See accompanying notes to consolidated financial statements.
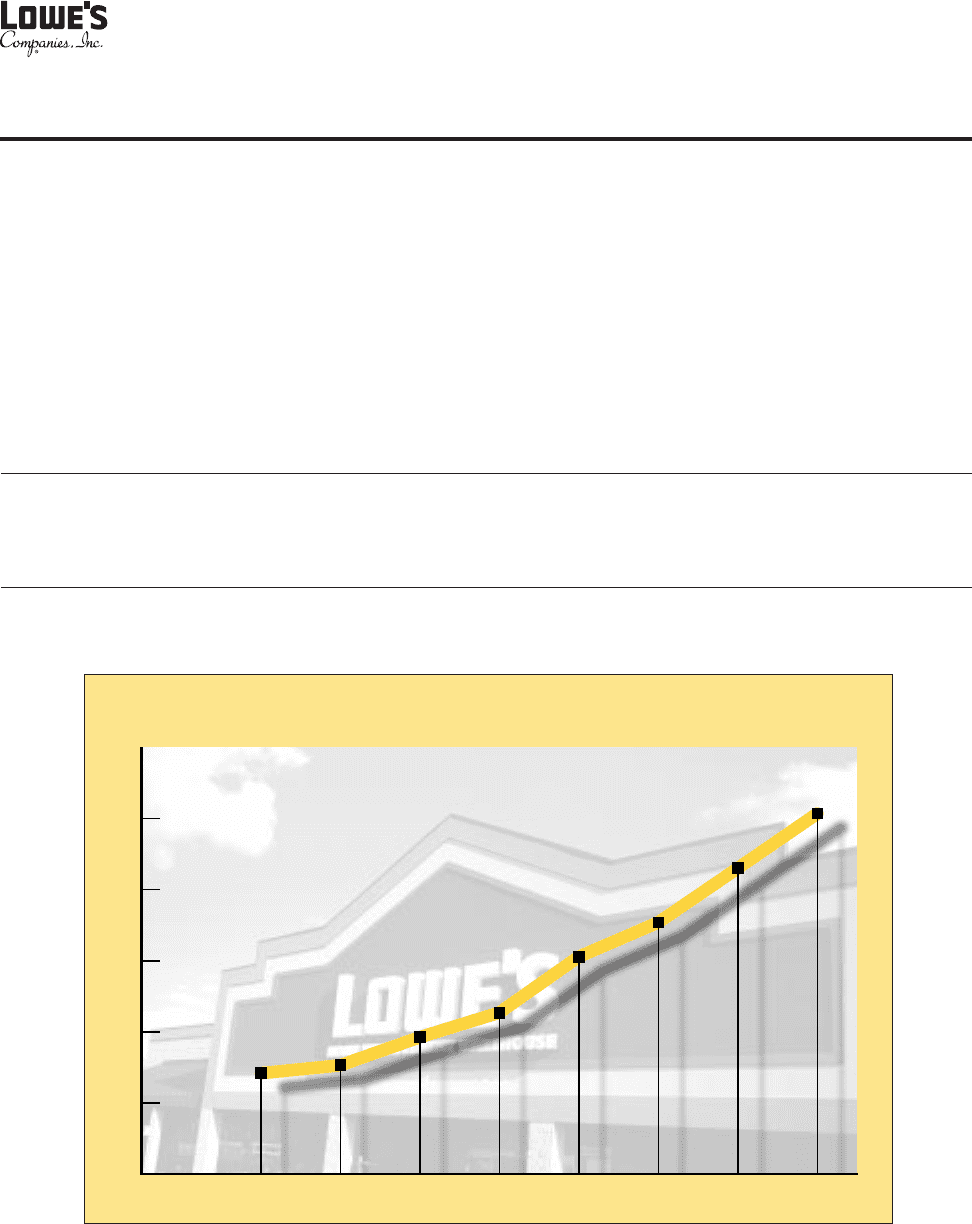
2
4
6
8
10
12
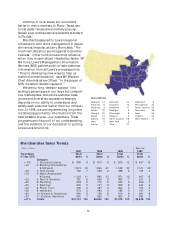
$ Billions
Fiscal Year
1990 1991 1992 1993 1994 1995 1996 1997
Lowe’s Sales Growth
22