Lowe's 2002 Annual Report Download - page 23
Download and view the complete annual report
Please find page 23 of the 2002 Lowe's annual report below. You can navigate through the pages in the report by either clicking on the pages listed below, or by using the keyword search tool below to find specific information within the annual report.-
 1
1 -
2
-
3
-
4
-
5
-
6
-
7
-
8
-
9
-
10
-
11
-
12
-
 13
13 -
 14
14 -
 15
15 -
 16
16 -
 17
17 -
 18
18 -
 19
19 -
 20
20 -
 21
21 -
 22
22 -
 23
23 -
 24
24 -
 25
25 -
 26
26 -
 27
27 -
 28
28 -
 29
29 -
 30
30 -
 31
31 -
 32
32 -
 33
33 -
34
-
35
-
36
-
37
-
38
-
39
-
40
-
41
-
42
-
43
-
44
-
45
-
46
-
47
-
48
 |
 |

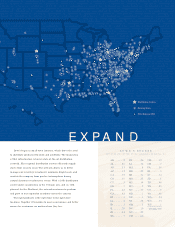
higher than 2000 levels. The increases in sales are attributable to the
Company’s ongoing store expansion and relocation program and
comparable store sales increases. Comparable store sales increased
5.6% in 2002. The Company experienced slight deflation in lum-
ber prices during the year which were offset by inflation in other
building material prices which resulted in essentially no impact on
comparable store sales. The comparable store sales increase prima-
rily resulted from improved sales in almost all merchandising cate-
gories. During the year, the Company experienced its strongest
sales increases in appliances, cabinets, flooring, home organization,
outdoor power equipment, paint, rough plumbing and walls and
windows. The following table presents sales and store information:
2002 2001 2000
Sales (in millions) $26,491 $22,111
$18,779
Sales Increases 20% 18%
18%
Comparable Store Sales Increases 6% 2%
1%
At end of year:
Stores 854 744
650
Sales Floor Square Feet (in millions) 94.7
80.7 67.8
Average Store Size Square Feet (in thousands) 111
108 104
Gross margin in 2002 was 30.3% of sales compared to 28.8%
in 2001. Both of these years showed improvement over the 28.2%
rate achieved in 2000. Margin improvements have continued
throughout all three years, primarily from product mix improve-
ments, lower costs from continued progress in line reviews and
improved shrinkage.
Selling, General and Administrative (SG&A) expenses were
$4.7 billion or 17.9% of sales in 2002. SG&A expenses in the two
previous years were $3.9 billion and $3.3 billion or 17.7% and
17.8% of sales, respectively. During 2002, SG&A increased 21%
compared to the 20% increase in sales. In 2001, SG& A increased
17% compared to the 18% sales increase. In 2000, SG&A
increased 21% compared to the 18% sales increase. The increase
as a percent to sales in SG& A in 2002 was primarily due to
increased store salaries combined with increased bonus achieve-
ment levels driven by increased earnings. The decrease as a percent
to sales in SG&A during 2001 was primarily attributable to
expense controls involving payroll and advertising costs. The
increase as a percent to sales in SG& A during 2000 was primarily
attributable to an increase in store salaries combined with lower
than expected sales levels.
Store opening costs, which were expensed as incurred, were
$128.7 million for 2002 compared to $139.9 million and $131.8
million in 2001 and 2000, respectively. These costs are associated
with the opening of 123 stores in 2002 (112 new and 11 relocat-
ed). This compares to 115 stores in 2001 (101 new and 14 relo-
cated) and 100 stores in 2000 (80 new and 20 relocated). Because
store opening costs are expensed as incurred, the expenses recog-
nized may fluctuate based on the timing of store openings in future
or prior periods. As a percentage of sales, store opening costs were
0.5% for 2002 compared to 0.6% and 0.7% in 2001 and 2000,
respectively. Store opening costs averaged approximately $1.0 mil-
lion, $1.2 million and $1.1 million per store in 2002, 2001 and
2000, respectively.
Depreciation, reflecting continued fixed asset expansion,
increased 21% to $626.6 million in 2002, compared to increases of
26% and 21% in 2001 and 2000, respectively. Depreciation as a
percentage of sales was 2.3% for 2002, a slight decrease from 2.4%
in 2001 and a slight increase from 2.2% in 2000. Approximately
6% of new store facilities opened in the last three years have been
leased, of which approximately 26% were under capital leases.
Property, less accumulated depreciation, increased to $10.4 billion
at January 31, 2003 compared to $8.7 billion at February 1, 2002.
The increase in property resulted primarily from the Company’s
store expansion program and increased distribution capacity.
Net interest costs as a percent of sales were 0.7% for 2002,
0.8% for 2001 and 0.7% for 2000. Net interest costs totaled
$181.9 million in 2002, $173.5 million in 2001 and $120.8 mil-
lion in 2000. Interest costs have increased due to an increase in
debt levels and lower capitalized interest. Interest costs relating to
capital leases were $40.1 million, $40.4 million and $42.0 million
for 2002, 2001 and 2000, respectively. See the following discus-
sion of liquidity and capital resources.
The Company’s effective income tax rates were 37.6%, 37.0%
and 36.8% in 2002, 2001 and 2000, respectively. The higher rates
in 2002 and 2001 were primarily related to expansion into states
with higher state income tax rates.
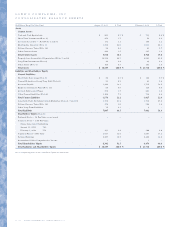
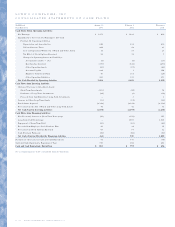
Liquidity and capital resources.
The following table summarizes the Company’s significant con-
tractual obligations and commercial commitments.
Payments Due by Period
Contractual ––––––––––––––––––––––––––––––––––––––––––––––––––––––––––––––––––––––––––––––––––––––––––––––––––––––––––––––––––––––––––––––––––––––––––––––––––––––––––––––––––––––
Obligations Less than 1-3 4-5 After 5
(In Millions) Total 1 year years years years
Short-Term Debt $ 50 $ 50 $ – $ – $ –
Long-Term Debt
(net of discount) 3,783 7 665 69 3,042
Capital Lease
Obligations 826 61 120 118 527
Operating Leases 3,163 212 412 403 2,136
Total Contractual
Cash Obligations $ 7,822 $ 330 $1,197 $ 590 $ 5,705