Lowe's 2002 Annual Report Download - page 37
Download and view the complete annual report
Please find page 37 of the 2002 Lowe's annual report below. You can navigate through the pages in the report by either clicking on the pages listed below, or by using the keyword search tool below to find specific information within the annual report.-
 1
1 -
2
-
3
-
4
-
5
-
6
-
7
-
8
-
9
-
10
-
11
-
12
-
13
-
14
-
15
-
16
-
17
-
18
-
19
-
20
-
21
-
22
-
23
-
24
-
25
-
26
-
 27
27 -
 28
28 -
 29
29 -
 30
30 -
 31
31 -
 32
32 -
 33
33 -
 34
34 -
 35
35 -
 36
36 -
 37
37 -
 38
38 -
 39
39 -
 40
40 -
 41
41 -
 42
42 -
 43
43 -
 44
44 -
 45
45 -
 46
46 -
 47
47 -
48
 |
 |

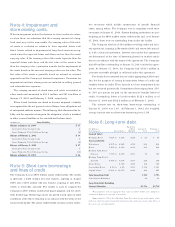
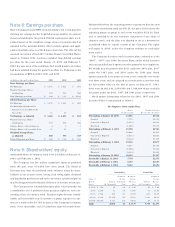
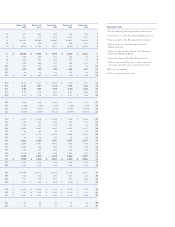
Note 8: Earnings per share.
Basic earnings per share (EPS) excludes dilution and is computed by
dividing net earnings by the weighted-average number of common
shares outstanding for the period. Diluted earnings per share is cal-
culated based on the weighted average shares of common stock as
adjusted for the potential dilutive effect of stock options and appli-
cable convertible notes as of the balance sheet date. The effect of the
assumed conversion of the $580.7 million Senior Convertible Notes,
issued in October 2001, has been excluded from diluted earnings
per share for the years ended January 31, 2003 and February 1,
2002, because none of the conditions that would permit conversion
had been satisfied during the period (see Note 6). Following is the
reconciliation of EPS for 2002, 2001 and 2000.
(In Millions, Except Per Share Data) 2002 2001 2000
Basic Earnings per Share:
Net Earnings $ 1,471 $ 1,023 $ 810
Weighted Average Shares
Outstanding 779 772 766
Basic Earnings per Share $ 1.89 $ 1.33 $ $1.06
Diluted Earnings per Share:
Net Earnings $ 1,471 $ 1,023 $ 810
Net Earnings Adjustment for
Interest on Convertible Debt
Net of Tax 11 10 –
Net Earnings, as Adjusted $ 1,482 $ 1,033 $ 810
Weighted Average Shares
Outstanding 779 772 766
Dilutive Effect of Stock Options 4 7 3
Dilutive Effect of Convertible Debt 17 16 –
Weighted Average Shares,
as Adjusted 800 795 769
Diluted Earnings per Share $ 1.85 $ 1.30 $ 1.05
Note 9: Shareholders’ equity.
Authorized shares of common stock were 2.8 billion at January 31,
2003 and February 1, 2002.
The Company has five million authorized shares of preferred
stock ($5 par), none of which have been issued. The Board of
Directors may issue the preferred stock (without action by share-
holders) in one or more series, having such voting rights, dividend
and liquidation preferences and such conversion and other rights as
may be designated by the Board of Directors at the time of issuance.
The Company has a shareholder rights plan, which provides for
a distribution of 0.5 preferred share purchase rights on each out-
standing share of common stock. Purchase rights become distrib-
utable and exercisable only if a person or group acquires or com-
mences a tender offer for 15% or more of the Company’s common
stock. Once exercisable, each 0.5 purchase right will entitle share-
holders (other than the acquiring person or group) to buy one unit
of a series of preferred stock for $76.25; the price of the unit to the
acquiring person or group in such event would be $152.50. Each
unit is intended to be the economic equivalent of one share of
common stock, and the plan was adopted to act as a deterrent to
unsolicited offers to acquire control of the Company. The rights
will expire in 2008, unless the Company redeems or exchanges
them earlier.
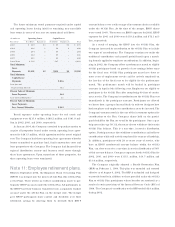
The Company has three stock incentive plans, referred to as the
“2001”, “1997” and “1994” Incentive Plans, under which incentive
and non-qualified stock options may be granted to key employees.
No awards may be granted after 2011 under the 2001 plan, 2007
under the 1997 plan, and 2004 under the 1994 plan. Stock
options generally have terms of seven years, normally vest evenly
over three years, and are assigned an exercise price of not less than
the fair market value on the date of grant. At January 31, 2003,
there were 20,891,436, 2,059,958 and 1,398,360 shares available
for grants under the 2001, 1997 and 1994 plans, respectively.
Stock option information related to the 2001, 1997 and 1994
Incentive Plans is summarized as follows:
Key Employee Stock Option Plans
Shares Weighted-Average
(In Thousands) Exercise Price Per Share
Outstanding at January 28, 2000 11,066 $16.18
Granted 7,370 $23.39
Canceled or Expired (1,672) $23.33
Exercised (1,256) $10.03
Outstanding at February 2, 2001 15,508 $19.43
Granted 10,866 $34.17
Canceled or Expired (1,611) $25.50
Exercised (5,622) $14.99
Outstanding at February 1, 2002 19,141 $28.77
Granted 5,537 $43.65
Canceled or Expired (1,085) $34.28
Exercised (2,942) $22.20
Outstanding at January 31, 2003 20,651 $33.37
Exercisable at January 31, 2003 7,770 $23.75
Exercisable at February 1, 2002 6,707 $21.67
Exercisable at February 2, 2001 9,422 $16.94
Outstanding Exercisable
––––––––––––––––––––––––––––––––––––––––––––––––––––––––––––––––––––––––––––––––––––– –––––––––––––––––––––––––––––––––––––––––––––––––––––––––––––––––
Weighted- Weighted- Weighted-
Range of Average Average Average
Exercise Options Remaining Exercise Options Exercise
Prices (In Thousands) Term Price (In Thousands) Price
$5.18 - $ 7.52 95 2.4 $ 5.96 95 $ 5.96
8.70 - 12.90 31 3.0 11.67 31 11.67
13.19 - 19.44 236 4.3 15.07 235 15.07
21.34 - 31.16 11,178 4.3 25.23 7,310 24.13
$32.04 - $ 45.70 9,111 6.0 44.16 99 37.12
Totals 20,651 5.1 $ 33.37 7,770 $ 23.75