Lowe's 2002 Annual Report Download - page 40
Download and view the complete annual report
Please find page 40 of the 2002 Lowe's annual report below. You can navigate through the pages in the report by either clicking on the pages listed below, or by using the keyword search tool below to find specific information within the annual report.-
 1
1 -
2
-
3
-
4
-
5
-
6
-
7
-
8
-
9
-
10
-
11
-
12
-
13
-
14
-
15
-
16
-
17
-
18
-
19
-
20
-
21
-
22
-
23
-
24
-
25
-
26
-
27
-
28
-
29
-
 30
30 -
 31
31 -
 32
32 -
 33
33 -
 34
34 -
 35
35 -
 36
36 -
 37
37 -
 38
38 -
 39
39 -
 40
40 -
 41
41 -
 42
42 -
 43
43 -
 44
44 -
 45
45 -
 46
46 -
 47
47 -
 48
48
 |
 |

38 / 39 LO WE’S CO MPANIES, INC. ANNUAL REPORT 2002
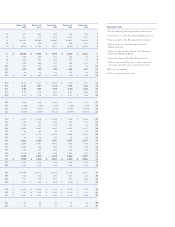
Note 12: Income taxes.
2002 2001 2000
Statutory Rate Reconciliation
Statutory Federal Income Tax Rate 35.0% 35.0% 35.0%
State Income Taxes—Net of Federal
Tax Benefit 3.3 3.0 2.7
Other, Net (0.7) (1.0) (0.9)
Effective Tax Rate 37.6% 37.0% 36.8%
(In Millions) Components of Income Tax Provision
Current
Federal $597 $490 $398
State 83 69 50
Total Current 680 559 448
Deferred
Federal 173 35 19
State 35 7 4
Total Deferred 208 42 23
Total Income Tax Provision $888 $601 $471
The tax effect of cumulative temporary differences that gave rise
to the deferred tax assets and liabilities at January 31, 2003 and
February 1, 2002 is as follows (in millions):
January 31, 2003
(In Millions) Assets Liabilities Total
Excess Property and
Store Closing Costs $ 24 $ – $ 24
Self-Insurance 58 – 58
Depreciation – (498) (498)
Vacation Accrual 5 – 5
Allowance for Sales Returns 26 – 26
Other, Net 6 (41) (35)
Total $ 119 $ (539) $ (420)
February 1, 2002
(In Millions) Assets Liabilities Total
Excess Property and
Store Closing Costs $ 28 $ – $ 28
Self-Insurance 63 – 63
Depreciation – (331) (331)
Vacation Accrual 27 – 27
Allowance for Sales Returns 9 – 9
Other, Net 12 (20) (8)
Total $ 139 $ (351) $ (212)
Note 13: Litigation.
The Company is a defendant in legal proceedings considered to be
in the normal course of business, none of which, singularly or col-
lectively, are considered material to the Company.
Note 14: Other information.
Net interest expense is composed of the following:
(In Millions) 2002 2001 2000
Long-Term Debt $163 $161 $117
Mortgage Interest 5 8 8
Capitalized Leases 40 41 42
Short-Term Debt 1 4 12
Amortization of Original Issue
Discount and Loan Costs 19 18 2
Interest Income (21) (24) (25)
Interest Capitalized (25) (34) (35)
Net Interest Expense $182 $174 $121
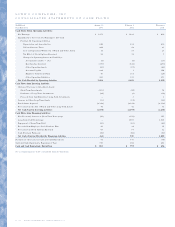
Supplemental Disclosures of Cash Flow Information:
(In Millions) 2002 2001 2000
Cash Paid for Interest
(Net of Amount Capitalized) $ 186 $ 178 $ 132
Cash Paid for Income Taxes $ 695 $ 532 $ 428
Noncash Investing and Financing Activities:
Fixed Assets Acquired under
Capital Leases $ 16 $ 13 $ 1
Termination of Capital Leases – – 2
Common Stock Issued to ESOP (Note 11) 79 63 –
Common Stock Issued to Executives and
Directors, net of Unearned Compensation – 2 8
Notes Received in Exchange for Sale
of Real Estate $ 4 $ 4 $ –
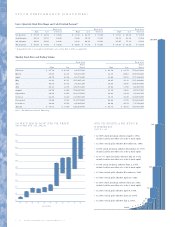
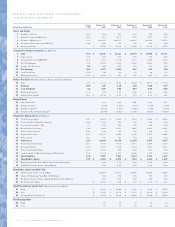
Sales by Product Category:
2002 2001 2000
–––––––––––––––––––––––––––––––––––––––––––– ––––––––––––––––––––––––––––––––––––––––– –––––––––––––––––––––––––––––––––––––––––
(Dollars in Millions) Total Total Total
Product Category Sales % Sales % Sales %
Appliances $ 2,997 11% $ 2,413 11 % $ 1,850 10 %
Lumber 2,226 8 2,001 9 1,745 9
Outdoor Fashion 1,738 7 1,441 7 1,348 7
Millwork 1,724 7 1,446 7 1,197 6
Nursery 1,656 6 1,401 6 1,193 6
Flooring 1,651 6 1,264 6 1,019 5
Fashion Electrical 1,626 6 1,341 6 1,135 6
Fashion Plumbing 1,556 6 1,263 6 1,046 6
Paint 1,504 6 1,232 5 982 5
Tools 1,500 6 1,281 6 1,124 6
Hardware 1,493 5 1,249 6 1,071 6
Building Materials 1,412 5 1,255 6 1,079 6
Cabinets/Furniture/
Shelving 1,263 4 997 4 818 4
Outdoor Power
Equipment 1,007 4 817 4 768 4
Rough Plumbing 847 3 704 3 604 3
Walls/Windows 707 3 550 2 466 3
Rough Electrical 666 3 566 3 490 3
Home Organization 482 2 381 1 310 2
Other 436 2 509 2 534 3
Totals $26,491 100 % $22,111 100 % $18,779 100 %