Lowe's 2002 Annual Report Download - page 43
Download and view the complete annual report
Please find page 43 of the 2002 Lowe's annual report below. You can navigate through the pages in the report by either clicking on the pages listed below, or by using the keyword search tool below to find specific information within the annual report.-
 1
1 -
2
-
3
-
4
-
5
-
6
-
7
-
8
-
9
-
10
-
11
-
12
-
13
-
14
-
15
-
16
-
17
-
18
-
19
-
20
-
21
-
22
-
23
-
24
-
25
-
26
-
27
-
28
-
29
-
30
-
31
-
32
-
 33
33 -
 34
34 -
 35
35 -
 36
36 -
 37
37 -
 38
38 -
 39
39 -
 40
40 -
 41
41 -
 42
42 -
 43
43 -
 44
44 -
 45
45 -
 46
46 -
 47
47 -
 48
48
 |
 |

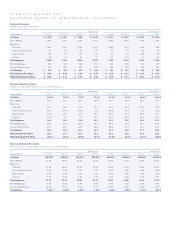
(In Millions, Except Per Share Data) 2002 2001 2000 1999 1998
Selected Statements of Earnings Data:
Net Sales $ 26,491 $ 22,111 $ 18,779 $ 15,906 $ 13,331
Gross Margin 8,026 6,368 5,291 4,381 3,574
Net Earnings 1,471 1,023 810 673 500
Basic Earnings Per Share 1.89 1.33 1.06 .88 .68
Diluted Earnings Per Share 1.85 1.30 1.05 .88 .67
Dividends Per Share $ .09 $ .08 $ .07 $ .06 $ .06
Selected Balance Sheet Data:
Total Assets $ 16,109 $ 13,736 $ 11,358 $ 9,007 $ 7,087
Long-Term Debt, Excluding Current Maturities $ 3,736 $ 3,734 $ 2,698 $ 1,727 $ 1,364
Selected Quarterly Data: First Second Third Fourth
2002
Net Sales $ 6,470 $ 7,488 $ 6,415 $ 6,118
Gross Margin 1,923 2,202 1,965 1,936
Net Earnings 346 467 339 319
Basic Earnings Per Share .45 .60 .44 .41
Diluted Earnings Per Share $ .44 $ .59 $ .43 $ .40
2001
Net Sales $ 5,276 $ 6,127 $ 5,455 $ 5,253
Gross Margin 1,493 1,718 1,591 1,566
Net Earnings 225 329 251 218
Basic Earnings Per Share .29 .43 .32 .28
Diluted Earnings Per Share $ .29 $ .42 $ .32 $ .28
LOWE’S CO MPANIES, INC.
SELECTED FINANCIAL DATA (UNAUDITED)