Lowe's 2002 Annual Report Download - page 44
Download and view the complete annual report
Please find page 44 of the 2002 Lowe's annual report below. You can navigate through the pages in the report by either clicking on the pages listed below, or by using the keyword search tool below to find specific information within the annual report.-
 1
1 -
2
-
3
-
4
-
5
-
6
-
7
-
8
-
9
-
10
-
11
-
12
-
13
-
14
-
15
-
16
-
17
-
18
-
19
-
20
-
21
-
22
-
23
-
24
-
25
-
26
-
27
-
28
-
29
-
30
-
31
-
32
-
33
-
 34
34 -
 35
35 -
 36
36 -
 37
37 -
 38
38 -
 39
39 -
 40
40 -
 41
41 -
 42
42 -
 43
43 -
 44
44 -
 45
45 -
 46
46 -
 47
47 -
 48
48
 |
 |

42 / 43 LO WE’S CO MPANIES, INC. ANNUAL REPORT 2002
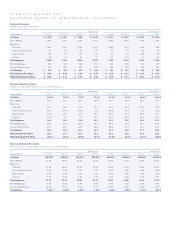
FINANCIAL HISTORY (UNAUDITED)
10-YEAR FINANCIAL INFORMATION
*
5-year January 31, February 1, February 2, January 28, January 29,
Fiscal Years Ended On CGR 2003 2002 2001 2000 1999
Stores and People
1Number of Stores 12.4 854 744 650 576 520
2Square Footage (In Millions) 18.9 94.7 80.7 67.8 57.0 47.8
3Number of Employees 13.7 121,600 108,317 94,601 86,160 72,715
4Customer Transactions (In Millions) 14.8 460 395 342 299 268
5Average Purchase $ 57.55 $ 55.96 $ 54.88 $ 53.16 $ 49.70
Comparative Income Statements (In Millions)
6Sales 19.0 $ 26,491 $ 22,111 $ 18,779 $ 15,906 $ 13,331
7Depreciation 19.6 626 517 409 337 289
8Operating Income (EBITDA)127.9 3,167 2,315 1,811 1,485 1,157
9Pre-Tax Earnings 31.6 2,359 1,624 1,281 1,063 787
10 Income Tax Provision NM 888 601 471 390 287
11 Net Earnings 30.9 1,471 1,023 810 673 500
12 Cash Dividends 11.6 66 60 53 48 41
13 Earnings Retained 32.4 $ 1,405 $ 963 $ 757 $ 625 $ 459
Dollars Per Share (Weighted Average Shares, Assuming Dilution)
14 Sales 17.2 $ 33.11 $ 27.83 $ 24.42 $ 20.72 $ 17.74
15 Earnings 28.9 1.85 1.30 1.05 0.88 0.67
16 Cash Dividends 8.4 0.09 0.08 0.07 0.06 0.06
17 Earnings Retained 30.2 1.76 1.21 0.98 0.81 0.61
18 Shareholders’ Equity 20.9 $ 10.38 $ 8.40 $ 7.15 $ 6.12 $ 4.82
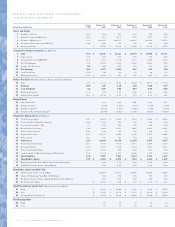
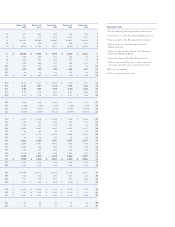
Financial Ratios
19 Asset Turnover21.93 1.95 2.08 2.24 2.27
20 Return on Sales35.55% 4.63% 4.31% 4.23% 3.75%
21 Return on Assets410.71% 9.01% 8.99% 9.49% 8.54%
22 Return on Shareholders’ Equity522.05% 18.62% 17.25% 18.59% 16.80%
Comparative Balance Sheets (In Millions)
23 Total Current Assets 18.1 $ 5,568 $ 4,920 $ 4,157 $ 3,688 $ 2,865
24 Cash and Short-Term Investments 32.6 1,126 853 469 569 249
25 Accounts Receivable— Net 7.7 172 166 161 148 144
26 Merchandise Inventory 14.9 3,968 3,611 3,285 2,812 2,385
27 Other Current Assets 44.5 244 197 161 105 45
28 Fixed Assets— Net 25.5 10,352 8,653 7,035 5,177 4,086
29 Other Assets 15.2 160 141 131 111 108
30 Total Assets 22.4 16,109 13,736 11,358 9,007 7,087
31 Total Current Liabilities 18.1 3,578 3,017 2,911 2,380 1,924
32 Accounts Payable 13.4 1,943 1,715 1,714 1,561 1,221
33 Other Current Liabilities 37.0 1,162 796 662 401 270
34 Long-Term Debt (Excluding Current Maturities) 25.7 3,736 3,734 2,698 1,727 1,364
35 Total Liabilities 22.0 7,807 7,062 5,863 4,311 3,467
36 Shareholders’ Equity 22.8 $ 8,302 $ 6,674 $ 5,495 $ 4,695 $ 3,620
37 Equity/Long-Term Debt (Excluding Current Maturities) 2.22 1.79 2.04 2.72 2.65
38 Year-End Leverage Factor: Assets/Equity 1.94 2.06 2.07 1.92 1.96
Shareholders, Shares and Book Value
39 Shareholders of Record, Year-End 25,405 19,277 16,895 15,446 14,508
40 Shares Outstanding, Year-End (In Millions) 782 776 766 765 749
41 Weighted Average Shares, Assuming Dilution (In Millions) 800 795 769 768 752
42 Book Value Per Share $ 10.62 $ 8.60 $ 7.17 $ 6.14 $ 4.83
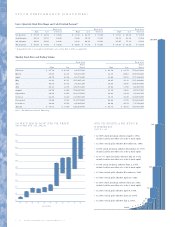
Stock Price During Calendar Year6(Adjusted for Stock Splits)
43 High $ 49.99 $ 48.88 $ 33.63 $ 33.22 $ 25.84
44 Low $ 32.50 $ 24.79 $ 17.13 $ 21.50 $ 11.00
45 Closing Price December 31 $ 36.50 $ 46.41 $ 22.25 $ 29.88 $ 25.59
Price/Earnings Ratio
46 High 27 38 32 38 39
47 Low 18 19 16 24 16