Lowe's 2002 Annual Report Download - page 24
Download and view the complete annual report
Please find page 24 of the 2002 Lowe's annual report below. You can navigate through the pages in the report by either clicking on the pages listed below, or by using the keyword search tool below to find specific information within the annual report.-
 1
1 -
2
-
3
-
4
-
5
-
6
-
7
-
8
-
9
-
10
-
11
-
12
-
13
-
 14
14 -
 15
15 -
 16
16 -
 17
17 -
 18
18 -
 19
19 -
 20
20 -
 21
21 -
 22
22 -
 23
23 -
 24
24 -
 25
25 -
 26
26 -
 27
27 -
 28
28 -
 29
29 -
 30
30 -
 31
31 -
 32
32 -
 33
33 -
 34
34 -
35
-
36
-
37
-
38
-
39
-
40
-
41
-
42
-
43
-
44
-
45
-
46
-
47
-
48
 |
 |

22 / 23 LO WE’S CO MPANIES, INC. ANNUAL REPORT 2002
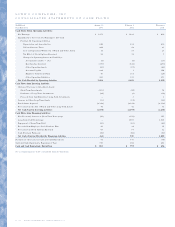
The primary sources of liquidity are cash flows from operating
activities and various lines of credit. Net cash provided by operating
activities was $2.7 billion for 2002 compared to $1.6 billion and
$1.1 billion in 2001 and 2000, respectively. The increase in cash
provided by operating activities during 2002 resulted primarily from
increased net earnings, improved payables leverage due to better
inventory turns and an increase in operating liabilities primarily due
to the increase in sales volume. The increase in cash provided by
operating activities during 2001 resulted primarily from increased
net earnings, the funding of the Company’s ESOP with the issuance
of common stock versus cash in the prior year and improved inven-
tory management. Working capital at January 31, 2003 was $2.0 bil-
lion compared to $1.9 billion at February 1, 2002.
The primary component of net cash used in investing activities
continues to be new store facilities and the infrastructure to sup-
port this growth. Cash acquisitions of fixed assets were $2.4 billion
for 2002. This compares to $2.2 billion and $2.3 billion for 2001
and 2000, respectively. Retail selling space as of January 31, 2003
increased 17% over the selling space as of February 1, 2002. The
February 1, 2002 selling space total of 80.7 million square feet rep-
resents a 19% increase over February 2, 2001.
Cash flows used in financing activities were $64.4 million in
2002. Cash flows provided by financing activities were $929.5 mil-
lion and $1.1 billion in 2001 and 2000, respectively. Financing uses
of cash in 2002 primarily consisted of $66.3 million from cash div-
idend payments, $62.0 million in scheduled debt repayments and
$50.0 million from the repayment of short-term borrowings. These
uses were partially offset by proceeds generated from stock option
exercises totaling $64.5 million and $49.3 million in cash proceeds
from the employee stock purchase plan. The cash provided by
financing activities in 2001 primarily resulted from the issuance of
$580.7 million aggregate principal amount of senior convertible
notes due October 2021 and $1.005 billion aggregate principal
amount of convertible notes due February 2021. These cash inflows
were offset by a decrease in cash due to the payment of $59.9 mil-
lion in cash dividends, $63.8 million in scheduled debt maturities
and the repayment of $150 million in short-term borrowings. In
2000, cash provided by financing activities included the issuance of
$500 million aggregate principal amount of 8.25% notes due June
2010 and $500 million aggregate principal amount of 7.50% notes
due December 2005. These proceeds were offset by a decrease in
cash of $53.5 million from cash dividend payments and $61.3 mil-
lion in scheduled debt repayments. The ratio of long-term debt to
equity plus long-term debt was 31.2%, 36.2% and 33.3% as of the
fiscal years ended 2002, 2001 and 2000, respectively.
The Company has an $800 million senior credit facility. The
facility is split into a $400 million five-year tranche, expiring in
August 2006 and a $400 million 364-day tranche, expiring in July
2003, which is renewable annually. The facility is used to support
the Company’s $800 million commercial paper program and for
short-term borrowings. Any loans made are priced based upon
market conditions at the time of funding in accordance with the
terms of the senior credit facility. The senior credit facility contains
certain restrictive covenants which include maintenance of specif-
ic financial ratios, among others. The Company was in compliance
with these covenants at January 31, 2003. Sixteen banking insti-
tutions are participating in the $800 million senior credit facility
and, as of January 31, 2003, there were no outstanding loans
under the facility.
The Company also has a $100 million revolving credit and
security agreement with a financial institution, expiring in
November 2003 which is renewable for successive periods not to
exceed 364 days each. Interest rates under this agreement are
determined at the time of borrowing based on market conditions
in accordance with the terms of the agreement. The Company had
$50 million outstanding at January 31, 2003 under this agree-
ment, and $136.3 million in customer accounts receivable pledged
as collateral.
Five banks have extended lines of credit aggregating $249.8
million for the purpose of issuing documentary letters of credit
and standby letters of credit. These lines do not have termination
dates but are reviewed periodically. Commitment fees ranging
from .25% to .50% per annum are paid on the amounts of stand-
by letters of credit issued. Outstanding letters of credit totaled
$122.4 million as of January 31, 2003 and $162.2 million as of
February 1, 2002.
In January 2003, the Company exercised its purchase option to
acquire all properties leased under certain operating lease agree-
ments for $261.5 million, which approximated the assets’ original
cost. The Company had three operating lease agreements whereby
lessors committed to purchase land, fund construction costs and
lease properties to the Company. The Company had financed four
regional distribution centers and fourteen retail stores through
these lease agreements. Upon repurchase of these properties, the
three operating leases were terminated.
The Company’s 2003 capital budget is $2.9 billion, inclusive
of approximately $181 million of operating or capital leases.
Approximately 80% of this planned commitment is for store
expansion and new distribution centers. Expansion plans for 2003
consist of approximately 130 stores, including approximately five