Lowe's 2002 Annual Report Download - page 41
Download and view the complete annual report
Please find page 41 of the 2002 Lowe's annual report below. You can navigate through the pages in the report by either clicking on the pages listed below, or by using the keyword search tool below to find specific information within the annual report.-
 1
1 -
2
-
3
-
4
-
5
-
6
-
7
-
8
-
9
-
10
-
11
-
12
-
13
-
14
-
15
-
16
-
17
-
18
-
19
-
20
-
21
-
22
-
23
-
24
-
25
-
26
-
27
-
28
-
29
-
30
-
 31
31 -
 32
32 -
 33
33 -
 34
34 -
 35
35 -
 36
36 -
 37
37 -
 38
38 -
 39
39 -
 40
40 -
 41
41 -
 42
42 -
 43
43 -
 44
44 -
 45
45 -
 46
46 -
 47
47 -
 48
48
 |
 |

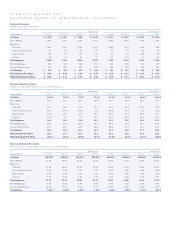
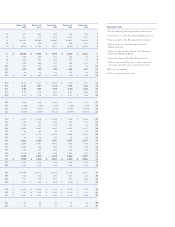
LOWE’S CO MPANIES, INC.
QUARTERLY REVIEW OF PERFORMANCE (UNAUDITED)
Earnings Statements
(In Millions, Except Per Share Data)
Fiscal 2002 Fiscal 2001
Quarter Ended 1/31/03 11/1/02 8/2/02 5/3/02 2/1/02 11/2/01 8/3/01 5/4/01
Net Sales $ 6,118 $ 6,415 $ 7,488 $ 6,470 $ 5,253 $ 5,455 $ 6,127 $ 5,276
Gross Margin 1,936 1,965 2,202 1,923 1,566 1,591 1,718 1,493
Expenses:
S,G & A 1,163 1,193 1,233 1,141 1,001 973 999 940
Store Opening Costs 41 27 24 37 33 43 28 36
Depreciation 169 159 153 145 139 134 125 119
Interest 45 44 46 47 47 43 43 41
Total Expenses 1,418 1,423 1,456 1,370 1,220 1,193 1,195 1,136
Pre-Tax Earnings 518 542 746 553 346 398 523 357
Income Tax Provision 199 203 279 207 128 147 194 132
Net Earnings $ 319 $ 339 $ 467 $ 346 $ 218 $ 251 $ 329 $ 225
Basic Earnings Per Share $ 0.41 $ 0.44 $ 0.60 $ 0.45 $ 0.28 $ 0.32 $ 0.43 $ 0.29
Diluted Earnings Per Share $ 0.40 $ 0.43 $ 0.59 $ 0.44 $ 0.28 $ 0.32 $ 0.42 $ 0.29
Earnings Statement Changes
Changes from same quarter previous year, to nearest tenth percent
Fiscal 2002 Fiscal 2001
Quarter Ended 1/31/03 11/1/02 8/2/02 5/3/02 2/1/02 11/2/01 8/3/01 5/4/01
Net Sales 16.5% 17.6% 22.2% 22.6% 15.6% 21.1% 16.4% 18.1%
Gross Margin 23.6 23.5 28.2 28.8 21.3 22.4 18.3 19.7
Expenses:
S,G & A 16.2 22.6 23.4 21.4 14.4 20.2 16.6 16.5
Store Opening Costs 24.2 (37.2) (14.3) 2.8 (20.0) 15.1 2.2 38.8
Depreciation 21.6 18.7 22.4 21.8 24.3 28.1 26.5 27.4
Interest (4.3) 2.3 7.0 14.6 13.8 55.0 62.5 58.9
Total Expenses 16.2 19.3 21.8 20.6 14.1 21.9 18.4 19.3
Pre-Tax Earnings 49.7 36.2 42.6 54.9 55.6 24.2 18.1 20.8
Income Tax Provision 55.5 38.1 43.8 56.8 56.5 24.9 18.7 21.4
Net Earnings 46.3 35.1 41.9 53.8 55.1 23.8 17.7 20.4
Basic Earnings Per Share 46.4 37.5 39.5 55.2 55.6 23.1 16.2 20.8
Diluted Earnings Per Share 42.9% 34.4% 40.5% 51.7% 55.6% 23.1% 16.7% 20.8%
Earnings Statement Percentages
Percent of sales to nearest hundredth; income tax is % of pre-tax earnings
Fiscal 2002 Fiscal 2001
Quarter Ended 1/31/03 11/1/02 8/2/02 5/3/02 2/1/02 11/2/01 8/3/01 5/4/01
Net Sales 100.00% 100.00% 100.00% 100.00% 100.00% 100.00% 100.00% 100.00%
Gross Margin 31.64 30.63 29.41 29.72 29.80 29.17 28.04 28.31
Expenses:
S,G & A 19.01 18.60 16.47 17.64 19.05 17.84 16.32 17.81
Store Opening Costs 0.66 0.42 0.33 0.57 0.63 0.78 0.46 0.68
Depreciation 2.76 2.48 2.03 2.23 2.64 2.46 2.03 2.26
Interest 0.74 0.68 0.62 0.73 0.88 0.80 0.70 0.78
Total Expenses 23.17 22.18 19.45 21.17 23.20 21.88 19.51 21.53
Pre-Tax Earnings 8.47 8.45 9.96 8.55 6.60 7.29 8.53 6.78
Income Tax Provision 38.42 37.46 37.40 37.43 37.00 37.00 37.00 37.00
Net Earnings 5.21% 5.28% 6.24% 5.35% 4.16% 4.59% 5.37% 4.27%