Lowe's 2004 Annual Report Download - page 20
Download and view the complete annual report
Please find page 20 of the 2004 Lowe's annual report below. You can navigate through the pages in the report by either clicking on the pages listed below, or by using the keyword search tool below to find specific information within the annual report.-
 1
1 -
2
-
3
-
4
-
5
-
6
-
7
-
8
-
9
-
 10
10 -
 11
11 -
 12
12 -
 13
13 -
 14
14 -
 15
15 -
 16
16 -
 17
17 -
 18
18 -
 19
19 -
 20
20 -
 21
21 -
 22
22 -
 23
23 -
 24
24 -
 25
25 -
 26
26 -
 27
27 -
 28
28 -
 29
29 -
 30
30 -
31
-
32
-
33
-
34
-
35
-
36
-
37
-
38
-
39
-
40
-
41
-
42
-
43
-
44
-
45
-
46
-
47
-
48
-
49
-
50
-
51
-
52
 |
 |

Page 18 Lowe’s 2004 Annual Report
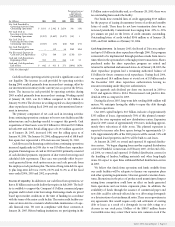
This discussion summarizes the significant factors affecting our con-
solidated operating results, financial condition, liquidity and capital
resources during the three-year period ended January 28, 2005 (our
fiscal years 2004, 2003 and 2002). Each of the fiscal years presented
contains 52 weeks of sales and expenses. This discussion should be
read in conjunction with the consolidated financial statements and
notes to the consolidated financial statements included in this
annual report.
During the fourth quarter of fiscal 2003, we sold 26 commodity-
focused locations operating under The Contractor Yard name (the
“Contractor Yards”). This sale was effected to allow us to continue to
focus on our retail and commercial business. In accordance with
Statement of Financial Accounting Standards (SFAS) No. 144,
“Accounting for the Impairment or Disposal of Long-Lived Assets,” we
have reported the results of operations of the Contractor Yards in dis-
continued operations for fiscal years 2003 and 2002.
Restatement of financial statements
As a result of our system of internal controls over financial reporting,
which includes monitoring of emerging accounting issues and the
review of peer filings, prior to fiscal 2004 year end, we initiated a
review of our accounting policies and practices surrounding leases. As
a result ofthis review, we determined that our treatment of certain
lease-related activities did not conform to accounting principles gen-
erally accepted in the United States of America. Subsequent to this
review, we concluded, in consultation with our independent registered
public accounting firm, Deloitte & Touche LLP, and following discus-
sions with the audit committee of the board of directors, to restate our
prior period financial statements to correct errors resulting from our
accounting for leases.
In the restatement, we accelerated depreciation expense for lease
assets and leasehold improvements to limit the depreciable lives of
those assets to the lease term, as determined in accordance with SFAS
No. 13, “Accounting for Leases,” which we define to include the non-
cancelable lease term and any option renewal period where failure to
exercise such option would result in an economic penalty in such
amount that renewal appears, at the inception of the lease, to be rea-
sonably assured. We also revised our calculation of rent expense (and
the related deferred rent liability) for ground leases by including in our
straight-line rent expense calculations any free-rent occupancy peri-
ods allowed under certain ground leases while our store is being con-
structed on the leased property. In the restatement, we also adjusted
our prior period financial statements to correct immaterial accounting
errors previously identified during the audits of those financial state-
ments. Our Forms 10-Q for fiscal 2005 will reflect the restated informa-
tion for the corresponding quarters in fiscal 2004.
See Note 2 to the consolidated financial statements for further dis-
cussion of the effects of these changes on our consolidated financial
statements. Unless otherwise expressly stated, all financial information
in this annual report is presented inclusive of these revisions.
Executive overview
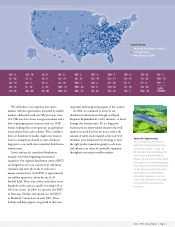
Fiscal 2004 represented another year of growth for Lowe’s. We ended
the year with 1,087 stores in 48 states, with plans to reach all 50 states
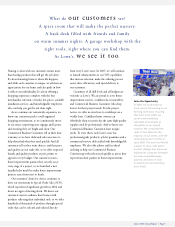
in the coming years. We serve approximately 11 million customers per
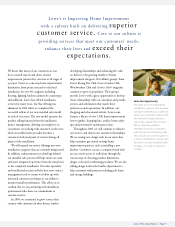
week at our stores. Our vision is to be our customers’ first choice for
home improvement in each and every market we serve. To achieve this
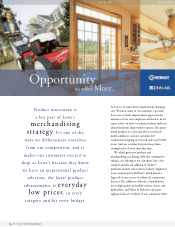
vision, we continue to focus on excellent customer service, Everyday
Low Prices (EDLP), and innovative operational and merchandising
strategies. We are also striving to expand our share of the home
improvement market.
The home improvement market is large, fragmented and growing,
due in part to certain socioeconomic trends. The increase in the medi-
an income of the “baby boomer” generation, along with their record
levels of second-home ownership and desire for professional installa-
tion services, is a source of the expected growth. Individuals are also
purchasing their first homes at a younger age. In addition, the number
of households with incomes greater than $120,000 has increased 73%
since 1995. These households spend more than twice the national
average on home improvement. Another source of growth in the
home improvement market is the growing home improvement expen-
ditures by minorities and immigrant populations. Minorities are
projected to contribute at least two-thirds of household growth in
coming decades.
We believe there are still significant opportunities for us to grow
within this increasing home improvement market. Large metropolitan
markets offer a source of opportunity for our expansion. In fiscal 2004,
only 54% of our stores were in the top 100 metropolitan markets.
These 100 markets comprise over 65% of the home improvement
market. Capitalizing on that opportunity, we opened stores in the New
York City, Chicago, Minneapolis and Milwaukee markets in fiscal
2004. We opened a total of 67 stores in the top 100 markets during
2004. In addition, expansion opportunities exist in many smaller mar-
kets utilizing our 94,000-square-foot (94K) store prototype. These are
stores that offer the same look and feel of our larger 116,000-square-
foot (116K) store prototype, with consolidated service in certain
departments and fewer SKUs. These stores have a lower average invest-
ment and operating expense structure, which allows us to profitably
serve these smaller markets.
We expect to open 150 stores in fiscal 2005, increasing total square
footage by 13-14%. We estimate approximately 80% will be the larger
store prototype to serve larger markets and 20% will be 94K stores to
serve smaller markets. Approximately 57% will be in the top 100 met-
ropolitan markets across the country.
Initiatives Driving Performance There are several key initiatives that
we continue to implement to drive the growth of our business and our
results of operations. These initiatives have been put into operation to
capitalize on the growth of the home improvement industry and iden-
tified socioeconomic trends. These initiatives are primarily related to
infrastructure, specialty sales, and merchandising and marketing.
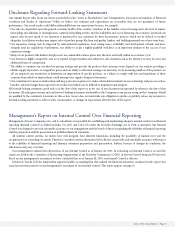
Management’s Discussion and
Analysis of Financial Condition and Results of Operations