Lowe's 2004 Annual Report Download - page 23
Download and view the complete annual report
Please find page 23 of the 2004 Lowe's annual report below. You can navigate through the pages in the report by either clicking on the pages listed below, or by using the keyword search tool below to find specific information within the annual report.-
 1
1 -
2
-
3
-
4
-
5
-
6
-
7
-
8
-
9
-
10
-
11
-
12
-
 13
13 -
 14
14 -
 15
15 -
 16
16 -
 17
17 -
 18
18 -
 19
19 -
 20
20 -
 21
21 -
 22
22 -
 23
23 -
 24
24 -
 25
25 -
 26
26 -
 27
27 -
 28
28 -
 29
29 -
 30
30 -
 31
31 -
 32
32 -
 33
33 -
34
-
35
-
36
-
37
-
38
-
39
-
40
-
41
-
42
-
43
-
44
-
45
-
46
-
47
-
48
-
49
-
50
-
51
-
52
 |
 |

Lowe’s 2004 Annual Report Page 21
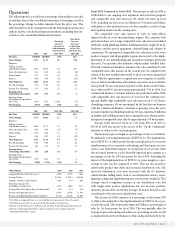
Operations
The following table sets forth the percentage relationship to net sales
of each line item of the consolidated statements of earnings, as well as
the percentage change in dollar amounts from the prior year. This
table should be read in conjunction with the following discussion and
analysis and the consolidated financial statements, including the relat-
ed notes to the consolidated financial statements.
Basis Point
Percentage Increase/
Increase/ (Decrease)
(Decrease) in in Percentage
Dollar Amounts of Net Sales
from Prior Year from Prior Year
–––––––––––––––––––––––––––––––––––– ––––––––––––––––––––––––––––––––––––
2004 2003 2003-2004 2003-2004
Net Sales 100.00% 100.00% 18% N/A
Gross Margin 33.73 31.15 28 258
Expenses:
Selling, General
and Administrative 20.74 18.09 36 265
Store Opening Costs 0.34 0.42 (4) (8)
Depreciation 2.47 2.52 16 (5)
Interest 0.48 0.58 (2) (10)
Total Expenses 24.03 21.61 32 242
Pre-Tax Earnings 9.70 9.54 20 16
Income Tax Provision 3.73 3.61 22 12
Earnings from
Continuing Operations 5.97 5.93 19 4
Earnings from
Discontinued Operations,
Net of Tax 0.00 0.05 (100) (5)
Net Earnings 5.97% 5.98% 18% (1)
2003 2002 2002-2003 2002-2003
Net Sales 100.00% 100.00% 18% N/A
Gross Margin 31.15 30.44 21 71
Expenses:
Selling, General
and Administrative 18.09 17.71 21 38
Store Opening Costs 0.42 0.49 (1) (7)
Depreciation 2.52 2.46 21 6
Interest 0.58 0.70 (1) (12)
Total Expenses 21.61 21.36 19 25
Pre-Tax Earnings 9.54 9.08 24 46
Income Tax Provision 3.61 3.42 25 19
Earnings from
Continuing Operations 5.93 5.66 24 27
Earnings from
Discontinued Operations,
Net of Tax 0.05 0.05 25 0
Net Earnings 5.98% 5.71% 24% 27
Other Metrics 2004 2003 2002
Comparable Store Sales Increases 16.6% 6.7% 5.8%
Average Ticket 2$ 63.43 $ 59.21 $ 56.80
Number of Stores (end of year) 1,087 952 828
Sales Floor Square Feet
(in millions, end of year) 123.7 108.8 94.7
Average Store Size Square Feet (in thousands) 114 114 114
Return on Beginning Assets 311.6% 11.6% 11.0%
Return on Beginning Shareholders’ Equity 421.3% 22.4% 22.6%
1 We define a comparable store as a store that has been open greater than 13 months.
2 We define average ticket as net sales divided by number of transactions.
3 Return on beginning assets is defined as net earnings divided by beginning total assets.
4 Return on beginning shareholders’ equity is defined as net earnings divided by
beginning shareholders’ equity.
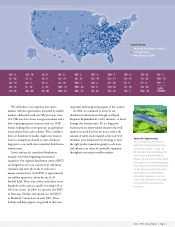
Fiscal 2004 Compared to Fiscal 2003 The increase in sales in 2004 is
attributable to our ongoing store expansion and relocation program
and comparable store sales increases. We added 140 stores in fiscal
2004, including our first stores in Minnesota, Wisconsin and Maine,
with plans to add additional stores in these markets as well as large
metropolitan markets in the coming years.
The comparable store sales increase of 6.6% in 2004 reflects
improved sales in every merchandising category. The categories that
performed above our average comparable store sales increase included
millwork, rough plumbing, lumber, building materials, rough electrical,
hardware, outdoor power equipment, seasonal living and cabinets &
countertops. We experienced comparable store sales increases for every
product category and all geographic regions due in part to the imple-
mentation of our merchandising and operations strategies previously
discussed. Our specialty sales initiatives, which include Installed Sales,
SOS and Commercial Business Customer sales, also contributed to the
comparable store sales increase in the current year. We completed the
rollout of the new installed sales model to all of our stores during fiscal
2004. With the opportunity to expand into new categories of installa-
tion, we believe installed sales will continue to provide an area of future
sales growth. We also experienced positive results from our SOS initia-
tives, with total SOS sales increasing approximately 27% in 2004. Our
Commercial Business Customer initiative also performed well in 2004,
with comparable store sales increases of over twice the company aver-
age and double-digit comparable store sales increases in 15 of 18 mer-
chandising categories. We are encouraged by the fact that our business
with the Commercial Business Customer is growing across the store,
not just in lumber and building materials. We also experienced inflation
in lumber and building material prices during the year, which positive-
ly impacted comparable store sales by approximately 150 basis points.
Average ticket increased $4.22 or 7.1% from $59.21 in 2003 to
$63.43 in 2004, due in part to the success of the “Up the Continuum”
initiative as well as Lowe’s credit programs.
The increase in gross margin as a percentage of sales was attributa-
ble primarily to the implementation of EITF 02-16. The implementa-
tion of EITF 02-16, which resulted in the reclassification of our vendor
reimbursements for cooperative advertising and third-party in-store
service costs from SG&A expense to a reduction of cost of sales when
the associated inventory is sold, favorably impacted gross margin as a
percentage of sales by 258 basis points for fiscal 2004. Excluding the
impact of the implementation of EITF 02-16, gross margin as a per-
centage of sales was flat compared to 2003. This was due in part to
unfavorable product mix shifts and increased distribution costs. The
increased distribution costs were associated with the R3 initiative,
which includes adding safety stock to our distribution centers, recon-
figuring racking and implementing new productivity standards. This
strategy caused a temporary increase in our distribution costs, but
with longer-term positive implications for our in-stock position,
inventory productivity and SG&A leverage. Increased fuel prices also
contributed to the increase in distribution costs.
The increase in SG&A expenses as a percentage of sales from 2003
to 2004 is due primarily to the implementation of EITF 02-16, as pre-
viously discussed. This unfavorably impacted SG&A as a percentage of
sales by 316 basis points for fiscal 2004. This was partially offset by
leverage in gross advertising and salaries as a percentage of sales, as well
as improvements in the performance of the credit portfolio held by GE.