Lowe's 2004 Annual Report Download - page 44
Download and view the complete annual report
Please find page 44 of the 2004 Lowe's annual report below. You can navigate through the pages in the report by either clicking on the pages listed below, or by using the keyword search tool below to find specific information within the annual report.-
 1
1 -
2
-
3
-
4
-
5
-
6
-
7
-
8
-
9
-
10
-
11
-
12
-
13
-
14
-
15
-
16
-
17
-
18
-
19
-
20
-
21
-
22
-
23
-
24
-
25
-
26
-
27
-
28
-
29
-
30
-
31
-
32
-
33
-
 34
34 -
 35
35 -
 36
36 -
 37
37 -
 38
38 -
 39
39 -
 40
40 -
 41
41 -
 42
42 -
 43
43 -
 44
44 -
 45
45 -
 46
46 -
 47
47 -
 48
48 -
 49
49 -
 50
50 -
 51
51 -
 52
52
 |
 |

Page 42 Lowe’s 2004 Annual Report
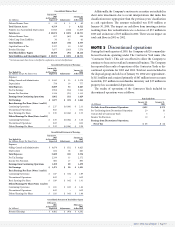
Lowe’s Companies, Inc.
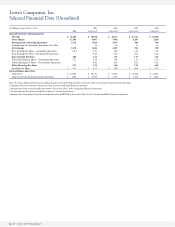
Selected Financial Data (Unaudited)
Note: The selected financial data has been adjusted to present the 2003 disposal of the Contractor Yards as a discontinued operation for all periods.
1 Amounts reflect the restatement discussed in Note 2 to the consolidated financial statements.
2 Amounts have been restated to reflect the matters discussed in Note 2 to the consolidated financial statements.
3 Certain amounts have been reclassified to conform to current classifications.
4 Amounts have been adjusted to reflect the implementation of EITF 04-8 discussed in Notes 1 and 11 to the consolidated financial statements.
(In Millions, Except Per Share Data) 2003 2002 2001 2000
2004 As Restated1,4 As Restated1,4 As Restated2,4 As Restated2
Selected Statements of Earnings Data:
Net Sales $ 36,464 $ 30,838 $ 26,112 $ 21,714 $ 18,368
Gross Margin 12,299 9,607 7,948 6,287 5,208
Earnings from Continuing Operations 2,176 1,829 1,479 969 784
Earnings from Discontinued Operations, Net of Tax – 15 12 13 14
Net Earnings 2,176 1,844 1,491 982 798
Basic Earnings Per Share – Continuing Operations 2.80 2.33 1.89 1.25 1.03
Basic Earnings Per Share – Discontinued Operations – 0.02 0.02 0.02 0.02
Basic Earnings Per Share 2.80 2.35 1.91 1.27 1.05
Diluted Earnings Per Share – Continuing Operations 2.71 2.26 1.84 1.21 1.02
Diluted Earnings Per Share – Discontinued Operations – 0.02 0.02 0.02 0.02
Diluted Earnings Per Share 2.71 2.28 1.86 1.23 1.04
Dividends Per Share $ 0.15 $ 0.11 $ 0.09 $ 0.08 $ 0.07
Selected Balance Sheet Data:
Total Assets3$ 21,209 $ 18,751 $ 15,843 $ 13,546 $ 11,287
Long-Term Debt, Excluding Current Maturities $ 3,060 $ 3,678 $ 3,736 $ 3,734 $ 2,698