Lowe's 2004 Annual Report Download - page 4
Download and view the complete annual report
Please find page 4 of the 2004 Lowe's annual report below. You can navigate through the pages in the report by either clicking on the pages listed below, or by using the keyword search tool below to find specific information within the annual report.-
 1
1 -
 2
2 -
 3
3 -
 4
4 -
 5
5 -
 6
6 -
 7
7 -
 8
8 -
 9
9 -
 10
10 -
 11
11 -
 12
12 -
 13
13 -
 14
14 -
 15
15 -
16
-
17
-
18
-
19
-
20
-
21
-
22
-
23
-
24
-
25
-
26
-
27
-
28
-
29
-
30
-
31
-
32
-
33
-
34
-
35
-
36
-
37
-
38
-
39
-
40
-
41
-
42
-
43
-
44
-
45
-
46
-
47
-
48
-
49
-
50
-
51
-
52
 |
 |

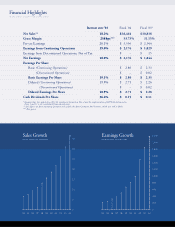
Financial Highlights
IN MILLIONS, EXCEPT PER SHARE DATA
Sales Growth
IN BILLIONS OF DOLLARS
Earnings Growth
IN MILLIONS OF DOLLARS
Increase over ’03 Fiscal ’04 Fiscal ’03*
* Amounts have been adjusted to reflect the restatement discussed in Note 2 and the implementation of EITF 04-8 discussed in
Notes 1 and 11 to the consolidated financial statements.
** Sales figures are from continuing operations and exclude sales from Contractor Yard locations, which were sold in 2003.
*** Basis points
Net Sales** 18.2% $ 36,464 $ 30,838
Gross Margin 258 bps*** 33.73% 31.15%
Pre-tax Earnings 20.1% $ 3,536 $ 2,944
Earnings from Continuing Operations 19.0% $ 2,176 $ 1,829
Earnings from Discontinued Operations, Net of Tax $ – $ 15
Net Earnings 18.0% $ 2,176 $ 1,844
Earnings Per Share
Basic (Continuing Operations) $ 2.80 $ 2.33
(Discontinued Operations) $ – $ 0.02
Basic Earnings Per Share 19.1% $ 2.80 $ 2.35
Diluted (Continuing Operations) 19.9% $ 2.71 $ 2.26
(Discontinued Operations) $ – $ 0.02
Diluted Earnings Per Share 18.9% $ 2.71 $ 2.28
Cash Dividends Per Share 36.4% $ 0.15 $ 0.11
95 96 97 98 99 00 01 02 03
0
5
10
15
20
25
30
35
94 04
0
200
400
600
800
1,000
1,200
1,400
1,600
1,800
2,000
2,200
95 96 97 98 99 00 01 02 03 0494