Lowe's 2004 Annual Report Download - page 24
Download and view the complete annual report
Please find page 24 of the 2004 Lowe's annual report below. You can navigate through the pages in the report by either clicking on the pages listed below, or by using the keyword search tool below to find specific information within the annual report.-
 1
1 -
2
-
3
-
4
-
5
-
6
-
7
-
8
-
9
-
10
-
11
-
12
-
13
-
 14
14 -
 15
15 -
 16
16 -
 17
17 -
 18
18 -
 19
19 -
 20
20 -
 21
21 -
 22
22 -
 23
23 -
 24
24 -
 25
25 -
 26
26 -
 27
27 -
 28
28 -
 29
29 -
 30
30 -
 31
31 -
 32
32 -
 33
33 -
 34
34 -
35
-
36
-
37
-
38
-
39
-
40
-
41
-
42
-
43
-
44
-
45
-
46
-
47
-
48
-
49
-
50
-
51
-
52
 |
 |

Page 22 Lowe’s 2004 Annual Report
Store opening costs, which include payroll and supply costs
incurred prior to store opening and grand opening advertising costs,
are expensed as incurred and totaled $123 million in 2004 compared to
$128 million in 2003. These costs are associated with the opening of 140
stores in 2004 (136 new and four relocated), as compared with the
opening of 130 stores in 2003 (125 new and five relocated). Because
store opening costs are expensed as incurred, the expenses recognized
may fluctuate based on the timing of store openings in future or prior
periods. Store opening costs averaged approximately $0.9 million per
store in 2004 versus approximately $1 million per store in 2003.
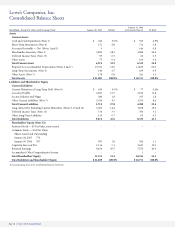
Depreciation leveraged five basis points as a percentage of sales in
fiscal 2004. Approximately 97% of new stores opened in the last three
years have been owned, which includes stores on leased land. Property,
less accumulated depreciation, increased to $13.9 billion at January 28,
2005, compared to $11.8 billion at January 30, 2004. The increase in
property resulted primarily from our store expansion program,
increased distribution capacity and an additional $300 million invest-
ment in information technology. We opened our tenth RDC in fiscal
2004, as well as additional flatbed distribution centers.
Interest expense has decreased due to lower debt levels resulting
from scheduled debt repayments. Interest expense relating to capital
leases was $38 million for 2004 and $39 million for 2003. For further
discussion, see Financial Condition, Liquidity and Capital Resources.
Our effective income tax rates were 38.5% and 37.9% in 2004 and
2003, respectively. The higher rate in 2004 was primarily the result of
expansion into states with higher state income tax rates, as well as per-
manent differences between book and tax income related to stock-
based compensation expense.
Fiscal 2003 Compared to Fiscal 2002 The comparable store sales
increase in 2003 of 6.7% primarily resulted from improved sales in
every merchandising category due to operational and merchandising
initiatives implemented in 2003. During fiscal 2003, we experienced
our strongest sales increases in lumber, building materials, outdoor
power equipment, major appliances, paint, flooring and home organ-
ization. In addition, millwork, hardware, walls & windows, nursery
and cabinets & countertops performed at approximately the overall
corporate average comparable store sales increase. We experienced
comparable store increases for every product category and all geo-
graphic regions. We experienced slight inflation in lumber and build-
ing material prices during fiscal 2003, which positively impacted com-
parable store sales by approximately 50 basis points.
The gross margin increase as a percentage of sales from 2002 to
2003 was driven by the reduction of inventory acquisition costs. These
lower inventory acquisition costs resulted in part from the product line
review process, which takes costs out of the supply chain, as well as the
use of our sourcing offices to import products when possible. From
2002 to 2003, the reduction of inventory shrinkage resulted in a 14
basis point increase in gross margin as a percentage of sales.
During 2003, SG&A expense increased 21% compared to the 18%
increase in sales. The increase as a percentage of sales in SG&A in
2003 was primarily due to stock-based compensation expense record-
ed as a result of the adoption of the fair value recognition provisions
of SFAS No. 123, “Accounting for Stock-Based Compensation,”
prospectively for all employee awards granted or modified after
January 31, 2003.
Store opening costs, which are expensed as incurred, were $128
million for 2003 compared to $129 million in 2002. These costs are
associated with the opening of 130 stores in 2003 (125 new and five
relocated) as compared to 123 stores in 2002 (112 new and 11 relocat-
ed). Because store opening costs are expensed as incurred, the expens-
es recognized may fluctuate based on the timing of store openings in
future or prior periods. Store opening costs averaged approximately
$1million per store in 2003 and slightly more than $1 million per store
in 2002.
Depreciation, reflecting continued expansion, increased 21% to
$777 million in 2003. Property, less accumulated depreciation,
increased to $11.8 billion at January 30, 2004, compared to $10.2 bil-
lion at January 31, 2003. The increase in property resulted primarily
from the Company’s store expansion program and increased distribu-
tion capacity.
Interest expense for 2003 decreased due to lower debt levels result-
ing from scheduled debt repayments. Interest expense relating to capi-
tal leases was $39 million for 2003 and $40 million for 2002. For further
discussion, see Financial Condition, Liquidity and Capital Resources.
Our effective income tax rates were 37.9% and 37.6% in 2003 and
2002, respectively. The higher rates were primarily related to expan-
sion into states with higher state income tax rates.
Financial condition, liquidity
and capital resources
Inventory growth of 30% outpaced sales growth of 18% in fiscal 2004
due to the implementation of distribution network initiatives. We are
increasing the shipments of product through our RDC network and
increasing the frequency of RDC deliveries to our stores. The R3 ini-
tiative enables us to move safety stock out of our stores and into our
RDC network. However, during fiscal 2004, safety stock was added to
the distribution network prior to reducing the safety stock in our
stores in order to maintain service levels. As we start reducing safety
stock in our stores, we will begin realizing the benefits of the R3 ini-
tiative in the form of inventory leverage and inventory turn improve-
ments in the latter half of 2005.
The decrease in accounts receivable in the current year resulted from
the sale of our portfolio of commercial business accounts receivable to
GE in May 2004. During the term of the agreement, which ends on
December 31, 2009, unless terminated sooner by the parties, GE also
purchases at face value new commercial business accounts receivable
originated by the Company and services these accounts. These receiv-
ables arise primarily from sales of goods and services to our
Commercial Business Customers. This agreement was effected prima-
rily to enhance our service to Commercial Business Customers through
the use of GE’s specialized support staff in servicing these accounts, as
well as the functionality of GE’s information systems platform.
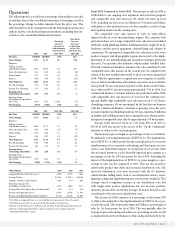
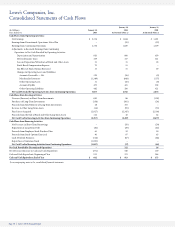
Cash Flows The following table summarizes the components of the
consolidated statements of cash flows, as well as the percentage change
in dollar amounts from the prior year. This table should be read in
conjunction with the following discussion and analysis and the con-
solidated financial statements, including the related notes to the con-
solidated financial statements: