Lowe's 2004 Annual Report Download - page 21
Download and view the complete annual report
Please find page 21 of the 2004 Lowe's annual report below. You can navigate through the pages in the report by either clicking on the pages listed below, or by using the keyword search tool below to find specific information within the annual report.-
 1
1 -
2
-
3
-
4
-
5
-
6
-
7
-
8
-
9
-
10
-
 11
11 -
 12
12 -
 13
13 -
 14
14 -
 15
15 -
 16
16 -
 17
17 -
 18
18 -
 19
19 -
 20
20 -
 21
21 -
 22
22 -
 23
23 -
 24
24 -
 25
25 -
 26
26 -
 27
27 -
 28
28 -
 29
29 -
 30
30 -
 31
31 -
32
-
33
-
34
-
35
-
36
-
37
-
38
-
39
-
40
-
41
-
42
-
43
-
44
-
45
-
46
-
47
-
48
-
49
-
50
-
51
-
52
 |
 |

Lowe’s 2004 Annual Report Page 19
Infrastructure
To support our expansion plans, we must have an appropriate infra-
structure. As a result, we have invested heavily in capital projects,
including new and existing stores, information technology and our
distribution network. We have devoted resources to technology to
improve efficiency and enhance customers’ shopping experiences.
We have also invested in our operational structure to ensure that it
adequately supports our employees so that they can effectively serve
our customers.
We continue to invest in our distribution network, as we opened
our tenth regional distribution center (RDC) in Florida during 2004,
with another opening in Connecticut in February 2005. We also own
and operate 10 flatbed distribution centers for warehousing and dis-
tributing long-length products. We have identified ways to reduce
lead-time variability of shipments through our RDC network and
drive better in-stock levels in our stores through our Rapid Response
Replenishment (R3) initiative. We are increasing the shipments of
product through our RDC network and increasing the frequency of
RDC deliveries to our stores. As a part of the R3 initiative, we will be
able to move safety stock out of our stores and into our RDC network.
By increasing the number of shipments to each store from our RDCs
and reducing vendor-direct deliveries, we will be able to quickly and
efficiently flow product to stores in the quantities necessary to support
sales demand. To maintain our service levels, we have taken a conser-
vative approach in implementing these changes by adding inventory to
our distribution network without lowering inventory levels in our
stores. As a result, inventory growth outpaced sales growth in fiscal
2004. As we start reducing safety stock in our stores, we will begin to
realize the benefits of the R3 initiative in the form of inventory lever-
age and inventory turn improvements in the latter half of 2005.
Specialty Sales
Our specialty sales initiatives include three major categories: Installed
Sales, Special Order Sales (SOS) and Commercial Business Customer
sales. We believe that these categories provide a significant opportuni-
ty for sales, gross margin and average ticket growth.
Installed Sales – Demand for “do-it-for-me” services has been driven
heavily by the economically affluent “baby boomer” population. As a
result, we have developed an installed sales model to ensure we can
capitalize on this growing sector of the home improvement market.
Each store is staffed with an installed sales manager responsible for
selecting the installer, monitoring quality and ensuring customer sat-
isfaction. Total installed sales increased approximately 27% in 2004.
SOS – Our SOS initiatives also continue to perform well, with total
SOS sales increasing approximately 27% in 2004. We currently offer
hundreds of thousands of products via special order. In fiscal 2004, we
continued to roll out an electronic sales tool that automates the con-
figuration, ordering, fulfillment and replenishment for special orders.
This tool is an example of how our investment in technology has
improved the product selection process, order entry and lead times,
making a special order even more customer-friendly than in the past.
Commercial Business Customer – We are continuing to focus our
efforts on the Commercial Business Customer. With our ongoing
national expansion making store locations more convenient, our logis-
tics systems ensuring we have the appropriate inventory levels to
ensure we have job lot quantities in stock and our EDLP strategy, we
experienced comparable store commercial sales increases of twice the
company average in fiscal 2004.
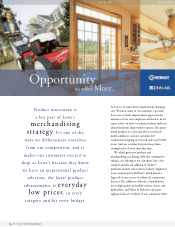
Merchandising and Marketing
Our key merchandising opportunities relate to appropriate product
line design, branding and the use of imports.
Product Line Design – We are focused on offering a rational mix of
opening price points to premium products to balance the objectives of
increased customer count and average ticket. Offering opening price
point products offers value and increases transactions, while our “Up
the Continuum” strategy drives higher average tickets and creates
choices for our customers who may desire more unique products.
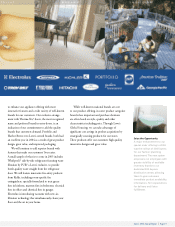
Brand Strategy and Use of Imports – We must also understand our
customers’ expectations around offering recognized and respected
brands. Our branding strategy is designed to build the Lowe’s brand
quickly, efficiently and effectively by offering our customers the best-
known and most-respected national brands. To maintain our EDLP
strategy and offer the high-quality products that our customers
demand, we have also increased product imports. Imports offer prod-
uct and design exclusivity, including proprietary brands, and an
opportunity for us to reduce inventory costs while maintaining con-
trol over product quality. In 2004, imports grew at almost twice the
rate of our total sales increase. We expect imports to continue to grow
over subsequent years.
Critical accounting policies and estimates
The following discussion and analysis of the financial condition and
results of operations are based on the consolidated financial state-
ments and notes to consolidated financial statements presented in this
annual report that have been prepared in accordance with accounting
principles generally accepted in the United States of America. The
preparation of these financial statements requires us to make estimates
that affect the reported amounts of assets, liabilities, sales and expens-
es, and related disclosures of contingent assets and liabilities. We base
these estimates on historical results and various other assumptions
believed to be reasonable, all of which form the basis for making esti-
mates concerning the carrying values of assets and liabilities that are
not readily available from other sources. Actual results may differ from
these estimates.
Our significant accounting polices are described in Note 1 to the
consolidated financial statements. We believe that the following
accounting policies affect the more significant estimates used in
preparing the consolidated financial statements.
Merchandise Inventory We record an inventory reserve for the loss
associated with selling discontinued inventories below cost. This
reserve is based on our current knowledge with respect to inventory
levels, sales trends and historical experience relating to the liquidation
of discontinued inventory. We do not believe that our merchandise
inventories are subject to significant risk of obsolescence in the near-
term, and we have the ability to adjust purchasing practices based on
anticipated sales trends and general economic conditions. However,
changes in consumer purchasing patterns could result in the need for
additional reserves. Using the methodology described herein, during