Lowe's 2004 Annual Report Download - page 30
Download and view the complete annual report
Please find page 30 of the 2004 Lowe's annual report below. You can navigate through the pages in the report by either clicking on the pages listed below, or by using the keyword search tool below to find specific information within the annual report.-
 1
1 -
2
-
3
-
4
-
5
-
6
-
7
-
8
-
9
-
10
-
11
-
12
-
13
-
14
-
15
-
16
-
17
-
18
-
19
-
 20
20 -
 21
21 -
 22
22 -
 23
23 -
 24
24 -
 25
25 -
 26
26 -
 27
27 -
 28
28 -
 29
29 -
 30
30 -
 31
31 -
 32
32 -
 33
33 -
 34
34 -
 35
35 -
 36
36 -
 37
37 -
 38
38 -
 39
39 -
 40
40 -
41
-
42
-
43
-
44
-
45
-
46
-
47
-
48
-
49
-
50
-
51
-
52
 |
 |

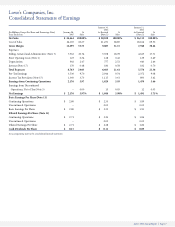
Page 28 Lowe’s 2004 Annual Report
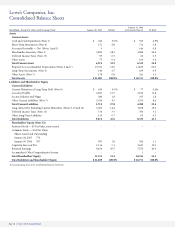
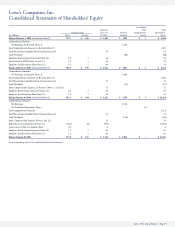
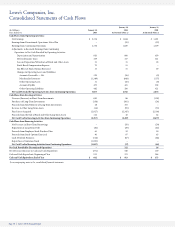
Lowe’s Companies, Inc.
Consolidated Balance Sheets
January 30, 2004
(In Millions, Except Par Value and Percentage Data) January 28, 2005 % Total As Restated (Note 2) % Total
Assets
Current Assets:
Cash and Cash Equivalents (Note 1) $ 642 3.0 % $ 913 4.9%
Short-Term Investments (Note 4) 171 0.8 711 3.8
Accounts Receivable — Net (Notes 1 and 5) 9 – 146 0.8
Merchandise Inventory (Note 1) 5,982 28.2 4,584 24.4
Deferred Income Taxes (Note 15) 95 0.5 62 0.3
Other Assets 75 0.4 106 0.6
Total Current Assets 6,974 32.9 6,522 34.8
Property, Less Accumulated Depreciation (Notes 6 and 7) 13,911 65.6 11,819 63.0
Long-Term Investments (Note 4) 146 0.7 169 0.9
Other Assets (Note 7) 178 0.8 241 1.3
Total Assets $ 21,209 100.0 % $ 18,751 100.0%
Liabilities and Shareholders’ Equity
Current Liabilities:
Current Maturities of Long-Term Debt (Note 9) $ 630 3.0 % $ 77 0.4%
Accounts Payable 2,687 12.7 2,212 11.8
Accrued Salaries and Wages 386 1.8 335 1.8
Other Current Liabilities (Note 7) 2,016 9.5 1,576 8.4
Total Current Liabilities 5,719 27.0 4,200 22.4
Long-Term Debt, Excluding Current Maturities (Notes 9, 10 and 13) 3,060 14.4 3,678 19.6
Deferred Income Taxes (Note 15) 736 3.5 594 3.2
Other Long-Term Liabilities 159 0.7 63 0.3
Total Liabilities 9,674 45.6 8,535 45.5
Shareholders’ Equity (Note 12):
Preferred Stock — $5 Par Value, none issued – – – –
Common Stock — $.50 Par Value;
Shares Issued and Outstanding
January 28, 2005 774
January 30, 2004 787 387 1.8 394 2.1
Capital in Excess of Par 1,514 7.1 2,247 12.0
Retained Earnings 9,634 45.5 7,574 40.4
Accumulated Other Comprehensive Income – – 1 –
Total Shareholders’ Equity 11,535 54.4 10,216 54.5
Total Liabilities and Shareholders’ Equity $ 21,209 100.0 % $ 18,751 100.0%
See accompanying notes to the consolidated financial statements.