Lowe's 2004 Annual Report Download - page 45
Download and view the complete annual report
Please find page 45 of the 2004 Lowe's annual report below. You can navigate through the pages in the report by either clicking on the pages listed below, or by using the keyword search tool below to find specific information within the annual report.-
 1
1 -
2
-
3
-
4
-
5
-
6
-
7
-
8
-
9
-
10
-
11
-
12
-
13
-
14
-
15
-
16
-
17
-
18
-
19
-
20
-
21
-
22
-
23
-
24
-
25
-
26
-
27
-
28
-
29
-
30
-
31
-
32
-
33
-
34
-
 35
35 -
 36
36 -
 37
37 -
 38
38 -
 39
39 -
 40
40 -
 41
41 -
 42
42 -
 43
43 -
 44
44 -
 45
45 -
 46
46 -
 47
47 -
 48
48 -
 49
49 -
 50
50 -
 51
51 -
 52
52
 |
 |

Lowe’s 2004 Annual Report Page 43
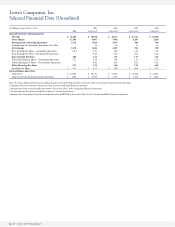
Lowe’s Companies, Inc.
Selected Financial Data (Unaudited) continued
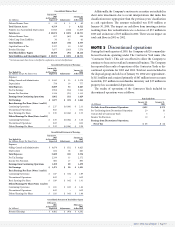
Sales by Product Category
(Dollars in Millions)
2004 2003 2002
–––––––––––––––––––––––––––––––––––––––––– –––––––––––––––––––––––––––––––––––––––– –––––––––––––––––––––––––––––––––––––––
Total Total Total
Product Category Sales % Sales % Sales %
Appliances $ 4,078 11% $ 3,518 11% $ 2,995 11 %
Lumber 3,288 9 2,652 9 2,232 9
Seasonal Living 2,442 7 2,008 7 1,738 7
Millwork 2,439 7 2,043 7 1,724 7
Flooring 2,370 6 1,998 6 1,651 6
Paint 2,317 6 2,048 7 1,737 7
Nursery 2,201 6 1,954 6 1,656 6
Tools 2,150 6 1,822 6 1,576 6
Fashion Plumbing 2,128 6 1,820 6 1,556 6
Lighting 2,089 6 1,857 6 1,586 6
Building Materials $ 2,025 6% $ 1,666 5% $ 1,408 5%
2004 2003 2002
–––––––––––––––––––––––––––––––––––––––––– –––––––––––––––––––––––––––––––––––––––– –––––––––––––––––––––––––––––––––––––––
Total Total Total
Product Category Sales % Sales % Sales %
Hardware $ 1,980 5% $ 1,667 5 % $ 1,417 5%
Outdoor Power
Equipment 1,511 4 1,202 4 983 4
Cabinets & Countertops 1,369 4 1,029 3 790 3
Rough Plumbing 1,161 3 982 3 847 3
Rough Electrical 977 3 791 3 683 3
Walls / Windows 951 3 848 3 707 3
Home Organization 793 2 670 2 528 2
Furniture 163 0 213 1 243 1
Other 32 0 50 0 55 0
Totals $ 36,464 100 % $ 30,838 100% $ 26,112 100%
Selected Quarterly Data: First Second Third
As Previously As As Previously As As Previously As
(In Millions, Except Per Share Data) Reported1Restated2Reported1Restated2Reported1Restated2Fourth
2004
Net Sales $ 8,681 $ 8,681 $ 10,169 $ 10,169 $ 9,064 $ 9,064 $ 8,550
Gross Margin 2,870 2,870 3,389 3,389 3,051 3,051 2,989
Earnings from Continuing Operations 455 452 704 700 522 516 508
Earnings from Discontinued Operations, Net of Tax – – – – – – –
Net Earnings 455 452 704 700 522 516 508
Basic Earnings Per Share – Continuing Operations 0.58 0.57 0.91 0.90 0.68 0.67 0.66
Basic Earnings Per Share – Discontinued Operations – – – – – – –
Basic Earnings Per Share 0.58 0.57 0.91 0.90 0.68 0.67 0.66
Diluted Earnings Per Share – Continuing Operations 0.56 0.56 0.88 0.87 0.65 0.64 0.64
Diluted Earnings Per Share – Discontinued Operations – – – – – – –
Diluted Earnings Per Share $ 0.56 $ 0.56 $ 0.88 $ 0.87 $ 0.65 $ 0.64 $ 0.64
Selected Quarterly Data: First Second Third Fourth
As Previously As As Previously As As Previously As As Previously As
(In Millions, Except Per Share Data) Reported1Restated2Reported1Restated2Reported1Restated2Reported1Restated2
2003
Net Sales $ 7,118 $ 7,118 $ 8,666 $ 8,666 $ 7,802 $ 7,802 $ 7,252 $ 7,252
Gross Margin 2,219 2,219 2,626 2,626 2,441 2,441 2,321 2,321
Earnings from Continuing Operations 419 404 594 588 448 442 401 395
Earnings from Discontinued Operations, Net of Tax 2 2 3 3 4 4 6 6
Net Earnings 421 406 597 591 452 446 407 401
Basic Earnings Per Share – Continuing Operations 0.54 0.52 0.76 0.75 0.56 0.56 0.51 0.50
Basic Earnings Per Share – Discontinued Operations – – – – 0.01 0.01 0.01 0.01
Basic Earnings Per Share 0.54 0.52 0.76 0.75 0.57 0.57 0.52 0.51
Diluted Earnings Per Share – Continuing Operations 0.52 0.50 0.74 0.73 0.55 0.55 0.49 0.48
Diluted Earnings Per Share – Discontinued Operations – – – – 0.01 0.01 0.01 0.01
Diluted Earnings Per Share $ 0.52 $ 0.50 $ 0.74 $ 0.73 $ 0.56 $ 0.56 $ 0.50 $ 0.49
Note: The selected financial data has been adjusted to present the 2003 disposal of the Contractor Yards as a discontinued operation for all periods.
1 Amounts have been adjusted to reflect the implementation of EITF 04-8 discussed in Notes 1 and 11 to the consolidated financial statements.
2 Amounts reflect the restatement discussed in Note 2 to the consolidated financial statements.