Lowe's 2009 Annual Report Download - page 22
Download and view the complete annual report
Please find page 22 of the 2009 Lowe's annual report below. You can navigate through the pages in the report by either clicking on the pages listed below, or by using the keyword search tool below to find specific information within the annual report.-
 1
1 -
2
-
3
-
4
-
5
-
6
-
7
-
8
-
9
-
10
-
11
-
 12
12 -
 13
13 -
 14
14 -
 15
15 -
 16
16 -
 17
17 -
 18
18 -
 19
19 -
 20
20 -
 21
21 -
 22
22 -
 23
23 -
 24
24 -
 25
25 -
 26
26 -
 27
27 -
 28
28 -
 29
29 -
 30
30 -
 31
31 -
 32
32 -
33
-
34
-
35
-
36
-
37
-
38
-
39
-
40
-
41
-
42
-
43
-
44
-
45
-
46
-
47
-
48
-
49
-
50
-
51
-
52
-
53
-
54
-
55
-
56
 |
 |

20
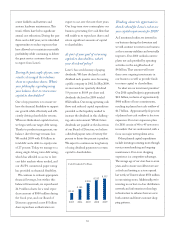
Other Metrics 2009 2008 2007
Comparable store sales (decrease) 2 (6.7)% (7.2)% (5.1)%
Total customer transactions (in millions) 766 740 720
Average ticket 3 $61.66 $65.15 $67.05
At end of year:
Number of stores 1,710 1,649 1,534
Sales floor square feet (in millions) 193 187 174
Average store size selling
square feet (in thousands) 4 113 113 113
Return on average assets 5 5.3% 6.8% 9.5%
Return on average shareholders’ equity 6 9.5% 12.7% 17.7%
1 EBIT margin is defined as earnings before interest and taxes as a percentage of sales
(operating margin).
2 A comparable store is defined as a store that has been open longer than 13 months. A store that
is identified for relocation is no longer considered comparable one month prior to its relocation.
e relocated store must then remain open longer than 13 months to be considered comparable.
3 Average ticket is defined as net sales divided by the total number of customer transactions.
4 Average store size selling square feet is defined as sales floor square feet divided by the number
of stores open at the end of the period.
5 Return on average assets is defined as net earnings divided by average total assets for the last
five quarters.
6 Return on average shareholders’ equity is defined as net earnings divided by average shareholders’
equity for the last five quarters.
2009 Compared to 2008
Net sales
Reflective of the continued challenging sales environment, net sales
decreased 2.1% to $47.2 billion in 2009. Comparable store sales
declined 6.7% in 2009 compared to a decline of 7.2% in 2008. Total
customer transactions increased 3.4% compared to 2008, driven by
our store expansion program. However, average ticket decreased 5.4%
to $61.66, primarily as a result of fewer project sales. Comparable
store customer transactions declined 1.0%, and comparable store
average ticket declined 5.7% compared to 2008.
Customers continued to focus on routine maintenance and repairs
instead of larger discretionary projects during 2009. We experienced
solid sales performance in paint and nursery as a result of the continued
willingness of homeowners to take on smaller DIY projects to maintain
their homes and improve their outdoor space. e paint category had
positive comparable store sales performance for each quarter during
2009. Appliances also performed better than our average comparable
store sales change driven by attractive value and customers’ willingness
to invest in products that increase energy efficiency. However, certain of
our other categories, including windows & walls, cabinets & countertops,
and millwork, which are more discretionary in nature, experienced
double-digit declines in comparable store sales for the year. We also
experienced continued weakness in other categories, including rough
electrical, lumber, and outdoor power equipment which also experienced
double-digit declines in comparable store sales driven by comparisons
to last year’s hurricane-related spending.
Due to consumers’ continued hesitancy to take on larger discre-
tionary projects, we experienced higher than average declines within
all specialty sales categories during 2009. Special Order Sales had a
15.8% decline in comparable store sales, due to weakness in cabinets &
countertops, windows & walls, lighting and millwork. Comparable store
Installed Sales declined 11.4% for 2009. However, both Special Order
Sales and Installed Sales experienced sequential improvement in the
third quarter of 2009, and positive comparable store sales in the
fourth quarter of 2009, as the economic pressures lessened. Sales to
Commercial Business Customers declined 9.1% in 2009 driven by
continued project delays within the remodel and repair businesses.
From a geographic market perspective, we experienced continued
pressure from the declining housing market, with the most pronounced
declines in the Mid-Atlantic and Florida markets for the year. Many
areas were impacted by several years of housing pressure as well as the
financial markets. However, we have seen evidence of broad-based
stabilization, as we experienced sequential improvement in comparable
store sales for all 50 states from the third to the fourth quarter, and
26 states had positive comparable results in the fourth quarter. For
2009, the northeast and north-central markets performed above
the Company average, and for the fourth quarter of 2009 these
areas delivered positive comparable store sales results. As a result,
we experienced a comparable store sales decline of 1.6% for the
fourth quarter, compared to a decline of 6.7% for the year.
Gross margin
For 2009, gross margin of 34.86% represented a 65 basis point increase
from 2008. Margin rate improvement contributed approximately 52 basis
points of this increase, primarily driven by a moderating promotional
environment and decreased seasonal markdowns. e seasonal living
category experienced strong margin increases compared to the prior year
driven by reduced markdowns as a result of rationalizing purchase levels
earlier in the year. e flooring and lighting product categories also
experienced strong improvement compared to the prior year driven by the
more rational promotional environment and our decision to not repeat
certain prior year promotions. In addition, margin was positively impacted
by lower inventory shrink, which provided 12 basis points of leverage.
For the fourth quarter of 2009, gross margin of 34.95% represented
a 122 basis point increase from the fourth quarter of 2008. In the
fourth quarter of 2008, we experienced lower margin rates as a result
of our efforts to clear seasonal inventory in our seasonal living and
tools categories, as well as markdowns associated with our decision to
exit wallpaper. In addition, there has been a more rational promotional
environment in the current year, which positively impacted the seasonal
living, windows & walls and lighting categories.
SG&A
e increase in SG&A as a percentage of sales from 2008 to 2009 was
primarily driven by de-leverage of 61 basis points in store payroll. As
sales per store declined, an increased number of stores met the base staffing
hours threshold, which increased the proportion of fixed-to-total payroll.
Although this created pressure on earnings, in the long-term it ensures that
we maintain the high service levels that customers have come to expect
from Lowe’s, and will ensure we have a knowledgeable and engaged
team in position as consumer demand stabilizes. We also experienced
de-leverage of approximately 40 basis points in bonus expense attributable
to higher achievement against performance targets in the current
year. As a result of current year performance and continued expansion
rationalization, we experienced 20 basis points of de-leverage associated
with the write-off of new store projects that we are no longer pursuing
and long-lived asset impairment charges. Employee insurance costs also
de-leveraged 18 basis points as a result of rising health care expenses, higher
enrollment and higher administrative costs. In the current year, credit
programs de-leveraged 16 basis points due to increases in aged losses and
bankruptcies as a result of higher unemployment and credit market