Lowe's 2009 Annual Report Download - page 26
Download and view the complete annual report
Please find page 26 of the 2009 Lowe's annual report below. You can navigate through the pages in the report by either clicking on the pages listed below, or by using the keyword search tool below to find specific information within the annual report.-
 1
1 -
2
-
3
-
4
-
5
-
6
-
7
-
8
-
9
-
10
-
11
-
12
-
13
-
14
-
15
-
 16
16 -
 17
17 -
 18
18 -
 19
19 -
 20
20 -
 21
21 -
 22
22 -
 23
23 -
 24
24 -
 25
25 -
 26
26 -
 27
27 -
 28
28 -
 29
29 -
 30
30 -
 31
31 -
 32
32 -
 33
33 -
 34
34 -
 35
35 -
 36
36 -
37
-
38
-
39
-
40
-
41
-
42
-
43
-
44
-
45
-
46
-
47
-
48
-
49
-
50
-
51
-
52
-
53
-
54
-
55
-
56
 |
 |

24
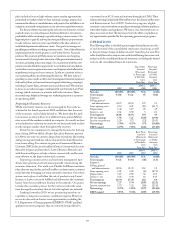
CONTRACTUAL OBLIGATIONS AND
COMMERCIAL COMMITMENTS
e following table summarizes our significant contractual obligations
and commercial commitments:
Payments Due by Period
Contractual Obligations Less an 1-3 4-5 After 5
(In millions) Total 1 Year Years Years Years
Long-term debt (principal
and interest amounts,
excluding discount) $ 8,974 $ 791 $1,057 $ 445 $ 6,681
Capitalized lease
obligations1 587 66 131 124 266
Operating leases1 6,164 409 815 787 4,153
Purchase obligations2 673 418 193 60 2
Total contractual
obligations $16,398 $1,684 $2,196 $1,416 $11,102
Amount of Commitment Expiration by Period
Commercial Commitments Less an 1-3 4-5 After 5
(In millions) Total 1 Year Years Years Years
Letters of credit 3 $327 $324 $ 3 $ – $ –
Surety bonds4 $286 $276 $10 $ – $ –
1 Amounts do not include taxes, common area maintenance, insurance or contingent rent because
these amounts have historically been insignificant.
2 Represents commitments related to certain marketing and information technology programs,
purchases of merchandise inventory and construction of buildings.
3 Letters of credit are issued for the purchase of import merchandise inventories, real estate
and construction contracts, and insurance programs.
4 Surety bonds are issued primarily to secure payment of workers’ compensation liability claims
in states where we are self-insured.
At January 29, 2010, approximately $9 million of the reserve for
uncertain tax positions (including penalties and interest) was classified
as a current liability and $160 million was classified as a non-current
liability. At this time, we are unable to make a reasonably reliable estimate
of the timing of payments in individual years beyond 12 months, due to
uncertainties in the timing of the effective settlement of tax positions.
CRITICAL ACCOUNTING POLICIES
AND ESTIMATES
e preparation of the consolidated financial statements and notes
to consolidated financial statements presented in this annual report
requires us to make estimates that affect the reported amounts of assets,
liabilities, sales and expenses, and related disclosures of contingent
assets and liabilities. We base these estimates on historical results
and various other assumptions believed to be reasonable, all of which
form the basis for making estimates concerning the carrying values
of assets and liabilities that are not readily available from other sources.
Actual results may differ from these estimates.
Our significant accounting policies are described in Note 1 to the
consolidated financial statements. We believe that the following
accounting policies affect the most significant estimates and manage-
ment judgments used in preparing the consolidated financial statements.
Merchandise Inventory
Description
We record an obsolete inventory reserve for the anticipated loss associated
with selling inventories below cost. is reserve is based on our current
knowledge with respect to inventory levels, sales trends and historical
experience. During 2009, our reserve decreased approximately $9 million
to $49 million as of January 29, 2010.
We also record an inventory reserve for the estimated shrinkage
between physical inventories. is reserve is based primarily on actual
shrinkage results from previous physical inventories. During 2009,
the inventory shrinkage reserve increased approximately $9 million
to $138 million as of January 29, 2010.
In addition, we receive funds from vendors in the normal course
of business, principally as a result of purchase volumes, sales, early
payments or promotions of vendors’ products, which generally do not
represent the reimbursement of specific, incremental and identifiable
costs that we incurred to sell the vendor’s product. We treat these
funds as a reduction in the cost of inventory as the amounts are
accrued, and recognize these funds as a reduction of cost of sales
when the inventory is sold.
Judgments and uncertainties involved in the estimate
We do not believe that our merchandise inventories are subject to
significant risk of obsolescence in the near term, and we have the ability
to adjust purchasing practices based on anticipated sales trends and
general economic conditions. However, changes in consumer purchasing
patterns or a deterioration in product quality could result in the need
for additional reserves. Likewise, changes in the estimated shrink
reserve may be necessary, based on the timing and results of physical
inventories. We also apply judgment in the determination of levels of
non-productive inventory and assumptions about net realizable value.
For vendor funds, we develop accrual rates based on the provisions
of the agreements in place. Due to the complexity and diversity of
the individual vendor agreements, we perform analyses and review
historical purchase trends and volumes throughout the year, adjust
accrual rates as appropriate and confirm actual amounts with select
vendors to ensure the amounts earned are appropriately recorded.
Amounts accrued throughout the year could be impacted if actual
purchase volumes differ from projected purchase volumes, especially
in the case of programs that provide for increased funding when
graduated purchase volumes are met.
Effect if actual results differ from assumptions
We have not made any material changes in the methodology used to
establish our inventory valuation or the related reserves for obsolete
inventory or inventory shrinkage during the past three years. We
believe that we have sufficient current and historical knowledge to
record reasonable estimates for both of these inventory reserves.
However, it is possible that actual results could differ from recorded
reserves. A 10% change in the amount of products considered obsolete
and, therefore, included in the calculation of our obsolete inventory
reserve would have affected net earnings by approximately $3 million
for 2009. A 10% change in the estimated shrinkage rate included in the
calculation of our inventory shrinkage reserve would have affected net
earnings by approximately $9 million for 2009.