Lowe's 2009 Annual Report Download - page 34
Download and view the complete annual report
Please find page 34 of the 2009 Lowe's annual report below. You can navigate through the pages in the report by either clicking on the pages listed below, or by using the keyword search tool below to find specific information within the annual report.-
 1
1 -
2
-
3
-
4
-
5
-
6
-
7
-
8
-
9
-
10
-
11
-
12
-
13
-
14
-
15
-
16
-
17
-
18
-
19
-
20
-
21
-
22
-
23
-
 24
24 -
 25
25 -
 26
26 -
 27
27 -
 28
28 -
 29
29 -
 30
30 -
 31
31 -
 32
32 -
 33
33 -
 34
34 -
 35
35 -
 36
36 -
 37
37 -
 38
38 -
 39
39 -
 40
40 -
 41
41 -
 42
42 -
 43
43 -
 44
44 -
45
-
46
-
47
-
48
-
49
-
50
-
51
-
52
-
53
-
54
-
55
-
56
 |
 |

32
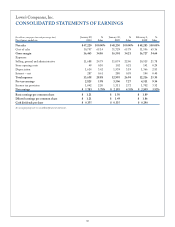
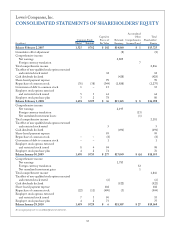
Lowe’s Companies, Inc.
CONSOLIDATED STATEMENTS OF SHAREHOLDERS’ EQUITY
Accumulated
Capital in Other Total
Common Stock Excess of Retained Comprehensive Shareholders’
(In millions) Shares Amount Par Value Earnings Income (Loss) Equity
Balance February 2, 2007 1,525 $ 762 $ 102 $ 14,860 $ 1 $ 15,725
Cumulative effect adjustment (8) (8)
Comprehensive income:
Net earnings 2,809
Foreign currency translation 7
Total comprehensive income 2,816
Tax effect of non-qualified stock options exercised
and restricted stock vested 12 12
Cash dividends declared (428) (428)
Share-based payment expense 99 99
Repurchase of common stock (76) (38) (349) (1,888) (2,275)
Conversion of debt to common stock 1 – 13 13
Employee stock options exercised
and restricted stock issued 5 3 61 64
Employee stock purchase plan 3 2 78 80
Balance February 1, 2008 1,458 $ 729 $ 16 $ 15,345 $ 8 $ 16,098
Comprehensive income:
Net earnings 2,195
Foreign currency translation (13)
Net unrealized investment losses (1)
Total comprehensive income 2,181
Tax effect of non-qualified stock options exercised
and restricted stock vested 5 5
Cash dividends declared (491) (491)
Share-based payment expense 95 95
Repurchase of common stock – – (8) (8)
Conversion of debt to common stock – – 1 1
Employee stock options exercised
and restricted stock issued 8 4 94 98
Employee stock purchase plan 4 2 74 76
Balance January 30, 2009 1,470 $ 735 $ 277 $ 17,049 $ (6) $ 18,055
Comprehensive income:
Net earnings 1,783
Foreign currency translation 32
Net unrealized investment gains 1
Total comprehensive income 1,816
Tax effect of non-qualified stock options exercised
and restricted stock vested (6) (6)
Cash dividends declared (522) (522)
Share-based payment expense 102 102
Repurchase of common stock (22) (11) (490) (3) (504)
Employee stock options exercised
and restricted stock issued 7 3 50 53
Employee stock purchase plan 4 2 73 75
Balance January 29, 2010 1,459 $ 729 $ 6 $ 18,307 $ 27 $ 19,069
See accompanying notes to consolidated financial statements.