Lowe's 2009 Annual Report Download - page 49
Download and view the complete annual report
Please find page 49 of the 2009 Lowe's annual report below. You can navigate through the pages in the report by either clicking on the pages listed below, or by using the keyword search tool below to find specific information within the annual report.-
 1
1 -
2
-
3
-
4
-
5
-
6
-
7
-
8
-
9
-
10
-
11
-
12
-
13
-
14
-
15
-
16
-
17
-
18
-
19
-
20
-
21
-
22
-
23
-
24
-
25
-
26
-
27
-
28
-
29
-
30
-
31
-
32
-
33
-
34
-
35
-
36
-
37
-
38
-
 39
39 -
 40
40 -
 41
41 -
 42
42 -
 43
43 -
 44
44 -
 45
45 -
 46
46 -
 47
47 -
 48
48 -
 49
49 -
 50
50 -
 51
51 -
 52
52 -
 53
53 -
 54
54 -
 55
55 -
 56
56
 |
 |

47
Alabama 38
Alaska 6
Arizona 32
Arkansas 20
California 106
Colorado 26
Connecticut 16
Delaware 10
Florida 117
Georgia 65
Hawaii 3
Idaho 8
Illinois 41
Indiana 44
Iowa 11
Kansas 11
Kentucky 42
Louisiana 32
Maine 12
Maryland 28
Massachusetts 25
Michigan 48
Minnesota 13
Mississippi 24
Missouri 45
Montana 5
Nebraska 5
Nevada 16
New Hampshire 14
New Jersey 38
New Mexico 11
New York 64
North Carolina 110
North Dakota 3
Ohio 83
Oklahoma 29
Oregon 13
Pennsylvania 76
Rhode Island 5
South Carolina 48
South Dakota 3
Tennessee 59
Texas 140
Utah 16
Vermont 2
Virginia 66
Washington 37
West Virginia 18
Wisconsin 9
Wyoming 1
Total U.S. Stores
1,694
Ontario
16
Total Stores
1,710
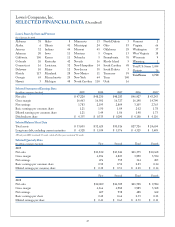
Lowe’s Companies, Inc.
SELECTED FINANCIAL DATA (Unaudited)
Lowe’s Stores by State and Province
(As of January 29, 2010)
Selected Statement of Earnings Data
(In millions, except per share data) 2009 2008 2007 2006 2005 1
Net sales $ 47,220 $ 48,230 $ 48,283 $ 46,927 $ 43,243
Gross margin 16,463 16,501 16,727 16,198 14,790
Net earnings 1,783 2,195 2,809 3,105 2,765
Basic earnings per common share 1.21 1.50 1.89 2.02 1.78
Diluted earnings per common share 1.21 1.49 1.86 1.98 1.73
Dividends per share $ 0.355 $ 0.335 $ 0.290 $ 0.180 $ 0.110
Selected Balance Sheet Data
Total assets $ 33,005 $ 32,625 $ 30,816 $ 27,726 $ 24,604
Long-term debt, excluding current maturities $ 4,528 $ 5,039 $ 5,576 $ 4,325 $ 3,499
1 Fiscal year 2005 contained 53 weeks, while all other years contained 52 weeks.
Selected Quarterly Data
(In millions, except per share data) First Second ird Fourth
2009
Net sales $11,832 $ 13,844 $11,375 $ 10,168
Gross margin 4,196 4,823 3,890 3,554
Net earnings 476 759 344 205
Basic earnings per common share 0.32 0.51 0.23 0.14
Diluted earnings per
common
share $ 0.32 $ 0.51 $ 0.23 $ 0.14
First Second ird Fourth
2008
Net sales $ 12,009 $ 14,509 $11,728 $ 9,984
Gross margin 4,166 4,982 3,985 3,368
Net earnings 607 938 488 162
Basic earnings per share 0.42 0.64 0.33 0.11
Diluted earnings per share $ 0.41 $ 0.63 $ 0.33 $ 0.11