Lowe's 2009 Annual Report Download - page 53
Download and view the complete annual report
Please find page 53 of the 2009 Lowe's annual report below. You can navigate through the pages in the report by either clicking on the pages listed below, or by using the keyword search tool below to find specific information within the annual report.-
 1
1 -
2
-
3
-
4
-
5
-
6
-
7
-
8
-
9
-
10
-
11
-
12
-
13
-
14
-
15
-
16
-
17
-
18
-
19
-
20
-
21
-
22
-
23
-
24
-
25
-
26
-
27
-
28
-
29
-
30
-
31
-
32
-
33
-
34
-
35
-
36
-
37
-
38
-
39
-
40
-
41
-
42
-
 43
43 -
 44
44 -
 45
45 -
 46
46 -
 47
47 -
 48
48 -
 49
49 -
 50
50 -
 51
51 -
 52
52 -
 53
53 -
 54
54 -
 55
55 -
 56
56
 |
 |

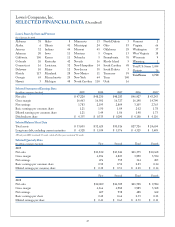
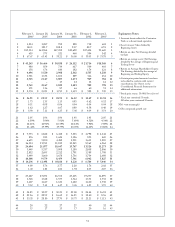
51
February 3, January 28, January 30, January 31, February 1, February 2,
2006* 2005 2004 2003 2002 2001*
1 1,234 1,087 952 828 718 624 1
2 140.1 123.7 108.8 94.7 80.7 67.8 2
3 185,314 161,964 147,052 120,692 107,404 93,669 3
4 639 575 521 460 394 342 4
5 $ 67.67 $ 63.43 $ 59.21 $ 56.80 $ 55.05 $ 53.78 5
6 $ 43,243 $ 36,464 $ 30,838 $ 26,112 $ 21,714 $ 18,368 6
7 980 859 739 617 509 403 7
8 158 176 180 182 174 121 8
9 4,496 3,520 2,908 2,362 1,535 1,238 9
10 1,731 1,353 1,101 889 566 454 10
11 2,765 2,167 1,807 1,473 969 784 11
12 – – 15 12 13 14 12
13 2,765 2,167 1,822 1,485 982 798 13
14 171 116 87 66 60 53 14
15 $ 2,594 $ 2,051 $ 1,735 $ 1,419 $ 922 $ 745 15
16 $ 26.91 $ 22.55 $ 18.91 $ 16.12 $ 13.49 $ 11.94 16
17 1.73 1.35 1.13 0.93 0.62 0.52 17
18 0.11 0.08 0.06 0.04 0.04 0.04 18
19 1.62 1.27 1.07 0.89 0.58 0.48 19
20 $ 8.90 $ 7.11 $ 6.25 $ 5.08 $ 4.09 $ 3.54 20
21 2.05 1.96 1.96 1.93 1.93 2.05 21
22 6.39% 5.94% 5.91% 5.69% 4.52% 4.34% 22
23 12.11% 10.91% 10.59% 10.14% 7.92% 7.89% 23
24 21.44% 19.99% 19.79% 20.05% 16.33% 15.80% 24
25 $ 7,753 $ 6,842 $ 6,418 $ 5,333 $ 4,798 $ 4,144 25
26 876 813 1,624 1,126 853 469 26
27 6,635 5,850 4,482 3,911 3,611 3,285 27
28 16,354 13,911 11,819 10,245 8,565 6,964 28
29 24,604 21,077 18,647 15,767 13,526 11,273 29
30 5,449 5,337 3,908 3,180 2,808 2,806 30
31 2,832 2,695 2,212 1,791 1,589 1,708 31
32 3,499 3,060 3,678 3,736 3,734 2,698 32
33 10,308 9,579 8,459 7,541 6,942 5,827 33
34 $ 14,296 $ 11,498 $ 10,188 $ 8,226 $ 6,584 $ 5,446 34
35 4.09 3.76 2.77 2.20 1.76 2.02 35
36 1.72 1.83 1.83 1.92 2.05 2.07 36
37 27,427 27,071 26,553 25,405 19,277 16,895 37
38 1,568 1,548 1,575 1,564 1,551 1,533 38
39 1,607 1,617 1,631 1,620 1,610 1,538 39
40 $ 9.12 $ 7.43 $ 6.47 $ 5.26 $ 4.25 $ 3.55 40
41 $ 34.85 $ 30.27 $ 30.21 $ 25.00 $ 24.44 $ 16.81 41
42 $ 25.36 $ 22.95 $ 16.69 $ 16.25 $ 12.40 $ 8.56 42
43 $ 33.33 $ 28.80 $ 27.70 $ 18.75 $ 23.21 $ 11.13 43
44 20 22 27 27 40 32 44
45 15 17 15 17 20 16 45
Explanatory Notes:
1 Amounts herein reflect the Contractor
Yards as a discontinued operation.
2 Asset turnover: Sales divided by
Beginning Assets
3 Return on sales: Net Earnings divided
by Sales
4 Return on average assets: Net Earnings
divided by the average of Beginning and
Ending Assets
5 Return on Average Shareholders’ Equity:
Net Earnings divided by the average of
Beginning and Ending Equity
6 Certain prior period amounts have been
reclassified to conform with current
classifications. See Note 1 to the
Consolidated Financial Statements for
additional information.
7 Stock price source: e Wall Street Journal
* Fiscal year contained 53 weeks.
All other years contained 52 weeks.
NM = not meaningful
CGR = compound growth rate