Lowe's 2009 Annual Report Download - page 35
Download and view the complete annual report
Please find page 35 of the 2009 Lowe's annual report below. You can navigate through the pages in the report by either clicking on the pages listed below, or by using the keyword search tool below to find specific information within the annual report.-
 1
1 -
2
-
3
-
4
-
5
-
6
-
7
-
8
-
9
-
10
-
11
-
12
-
13
-
14
-
15
-
16
-
17
-
18
-
19
-
20
-
21
-
22
-
23
-
24
-
 25
25 -
 26
26 -
 27
27 -
 28
28 -
 29
29 -
 30
30 -
 31
31 -
 32
32 -
 33
33 -
 34
34 -
 35
35 -
 36
36 -
 37
37 -
 38
38 -
 39
39 -
 40
40 -
 41
41 -
 42
42 -
 43
43 -
 44
44 -
 45
45 -
46
-
47
-
48
-
49
-
50
-
51
-
52
-
53
-
54
-
55
-
56
 |
 |

33
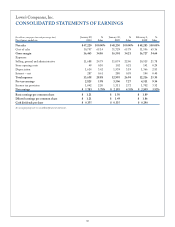
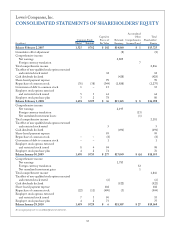
Lowe’s Companies, Inc.
CONSOLIDATED STATEMENTS OF CASH FLOWS
(In millions) January 29, January 30
, February 1,
Fiscal years ended on 2010
2009 2008
Cash flows from operating activities:
Net earnings $ 1,783 $ 2,195 $ 2,809
Adjustments to reconcile net earnings to net cash provided by operating activities:
Depreciation and amortization 1,733 1,667 1,464
Deferred income taxes (123) 69 2
Loss on property and other assets – net 193 89 51
Loss on redemption of long-term debt – 8 –
Share-based payment expense 102 95 99
Changes in operating assets and liabilities:
Merchandise inventory – net (28) (611) (464)
Other operating assets 7 31 (64)
Accounts payable 175 402 185
Other operating liabilities 212 177 265
Net cash provided by operating activities 4,054 4,122 4,347
Cash flows from investing activities:
Purchases of short-term investments (344) (210) (920)
Proceeds from sale/maturity of short-term investments 624 431 1,183
Purchases of long-term investments (1,483) (1,148) (1,588)
Proceeds from sale/maturity of long-term investments 1,160 994 1,162
Increase in other long-term assets (62) (56) (7)
Property acquired (1,799) (3,266) (4,010)
Proceeds from sale of property and other long-term assets 18 29 57
Net cash used in investing activities (1,886) (3,226) (4,123)
Cash flows from financing activities:
Net (decrease) increase in short-term borrowings (1,007) (57) 1,041
Proceeds from issuance of long-term debt 10 15 1,296
Repayment of long-term debt (37) (573) (96)
Proceeds from issuance of common stock under employee stock purchase plan 75 76 80
Proceeds from issuance of common stock from stock options exercised 53 98 69
Cash dividend payments (391) (491) (428)
Repurchases of common stock (504) (8) (2,275)
Excess tax benefits of share-based payments – 1 6
Net cash used in financing activities (1,801) (939) (307)
Effect of exchange rate changes on cash 20 7 –
Net increase (decrease) in cash and cash equivalents 387 (36) (83)
Cash and cash equivalents, beginning of year 245 281 364
Cash and cash equivalents, end of year $ 632 $ 245 $ 281
See accompanying notes to consolidated financial statements.