Lowe's 2009 Annual Report Download - page 23
Download and view the complete annual report
Please find page 23 of the 2009 Lowe's annual report below. You can navigate through the pages in the report by either clicking on the pages listed below, or by using the keyword search tool below to find specific information within the annual report.-
 1
1 -
2
-
3
-
4
-
5
-
6
-
7
-
8
-
9
-
10
-
11
-
12
-
 13
13 -
 14
14 -
 15
15 -
 16
16 -
 17
17 -
 18
18 -
 19
19 -
 20
20 -
 21
21 -
 22
22 -
 23
23 -
 24
24 -
 25
25 -
 26
26 -
 27
27 -
 28
28 -
 29
29 -
 30
30 -
 31
31 -
 32
32 -
 33
33 -
34
-
35
-
36
-
37
-
38
-
39
-
40
-
41
-
42
-
43
-
44
-
45
-
46
-
47
-
48
-
49
-
50
-
51
-
52
-
53
-
54
-
55
-
56
 |
 |

21
tightening. Additionally, we experienced de-leverage of approximately
16 basis points in fixed expenses such as property taxes, utilities and rent
during the year as a result of sales declines. For the fourth quarter of 2009,
SG&A deleveraged 103 basis points as compared to the fourth quarter
of 2008. e de-leverage was primarily attributable to the same factors
that contributed to the de-leverage in SG&A for the full year.
Store opening costs
Store opening costs, which include payroll and supply costs incurred
prior to store opening as well as grand opening advertising costs, totaled
$49 million in 2009, compared to $102 million in 2008. ese costs
are associated with the opening of 62 stores in 2009, as compared with
the opening of 115 stores in 2008. Store opening costs for stores
opened during both 2009 and 2008 averaged approximately $0.8 million
per store. Because store opening costs are expensed as incurred, the
timing of expense recognition fluctuates based on the timing of
store openings.
Depreciation
Depreciation de-leveraged 23 basis points as a percentage of sales in
2009. is de-leverage was driven by the comparable store sales declines
and the addition of 62 new stores in 2009. Property, less accumulated
depreciation, decreased to $22.5 billion at January 29, 2010, compared to
$22.7 billion at January 30, 2009. At January 29, 2010, and January 30,
2009, we owned 88% of our stores which included stores on leased land.
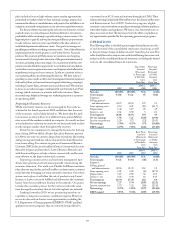
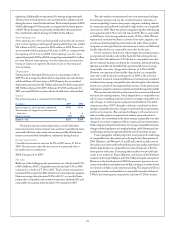
Interest
Net interest expense is comprised of the following:
(In millions) 2009 2008
Interest expense, net of amount capitalized $300 $314
Amortization of original issue discount and
loan costs 4 6
Interest income (17) (40)
Interest – net $287 $280
Net interest expense increased primarily as a result of the lower
interest income due to lower interest rates and lower capitalized interest
associated with fewer stores under construction, partially offset by lower
interest associated with favorable tax settlements during the year.
Income tax provision
Our effective income tax rate was 36.9% in 2009 versus 37.4% in
2008. e decrease in the effective tax rate was primarily due to
favorable state tax settlements.
2008 Compared to 2007
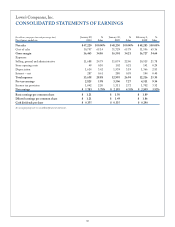
Net sales
Reflective of the challenging sales environment, net sales decreased 0.1%
to $48.2 billion in 2008. Comparable store sales declined 7.2% in 2008
compared to a decline of 5.1% in 2007. Total customer transactions
increased 2.8% compared to 2007, driven by our store expansion program.
However, average ticket decreased 2.8% to $65.15, as a result of fewer
project sales. Comparable store customer transactions declined 4.1%, and
comparable store average ticket declined 3.1% compared to 2007.
e sales weakness we experienced was most pronounced in larger
discretionary projects and was the result of dramatic reductions in
consumer spending. Certain of our project categories, including cabinets
& countertops and millwork, had double-digit declines in comparable
store sales for 2008. ese two project categories together with flooring
were approximately 17% of our total sales in 2008. is is comparable
to 2002 levels, after having peaked at nearly 18.5% in 2006. We also
experienced continued weakness in certain of our style categories, such
as fashion plumbing, lighting and windows & walls. ese product
categories are also typically more discretionary in nature and delivered
double-digit declines in comparable store sales for the year.
Due to consumers’ hesitancy to take on larger discretionary projects,
we experienced mixed results within Specialty Sales during the year.
Special Order Sales delivered a 9.5% decline in comparable store sales,
due to continued weakness in cabinets & countertops, fashion plumbing,
lighting and millwork. Installed Sales performed above our average
comparable store sales change with a decline of 6.0% for 2008.
However, we experienced low double-digit declines in comparable
store sales in the third and fourth quarters of 2008 as the economic
environment worsened. Commercial Business Customer sales continued
to deliver above-average comparable store sales throughout this industry
downturn as a result of our targeted efforts to focus on the professional
tradesperson, property maintenance professional and the repair/remodeler.
We experienced solid sales performance due to increased demand
for hurricane-related products, which helped drive a comparable store
sales increase in building materials and above-average comparable store
sales changes in outdoor power equipment and hardware. Favorable
comparisons due to 2007’s drought conditions contributed to above-
average comparable store sales changes in our lawn & landscape products
and nursery categories. e continued willingness of homeowners to
take on smaller projects to improve their outdoor space and maintain
their homes also contributed to the above-average comparable store sales
change in our nursery category, as well as in paint and home environment.
Other categories that performed above our average comparable store sales
change included appliances and rough plumbing, while flooring and sea-
sonal living performed at approximately the overall corporate average.
From a geographic market perspective, we experienced a wide range
of comparable store sales performance during the first three quarters of
2008. Markets in the Western U.S. and Florida, which include some of
the markets most pressured by the declining housing market, experienced
double-digit declines in comparable store sales during each of the first
three quarters of the year. Contrasting those markets we saw solid sales
results in our markets in Texas, Oklahoma, certain areas of the Northeast
and parts of the upper Midwest and Ohio Valley during the same period.
However, in the fourth quarter of 2008, the economic pressures on con-
sumers intensified as unemployment swelled, resulting in a further decline
in consumer confidence and consumer spending. is impacted all of our
geographic markets, and resulted in a comparable store sales decline of
9.9% for the fourth quarter, compared to a decline of 7.2% for the year.