Lowe's 2009 Annual Report Download - page 32
Download and view the complete annual report
Please find page 32 of the 2009 Lowe's annual report below. You can navigate through the pages in the report by either clicking on the pages listed below, or by using the keyword search tool below to find specific information within the annual report.-
 1
1 -
2
-
3
-
4
-
5
-
6
-
7
-
8
-
9
-
10
-
11
-
12
-
13
-
14
-
15
-
16
-
17
-
18
-
19
-
20
-
21
-
 22
22 -
 23
23 -
 24
24 -
 25
25 -
 26
26 -
 27
27 -
 28
28 -
 29
29 -
 30
30 -
 31
31 -
 32
32 -
 33
33 -
 34
34 -
 35
35 -
 36
36 -
 37
37 -
 38
38 -
 39
39 -
 40
40 -
 41
41 -
 42
42 -
43
-
44
-
45
-
46
-
47
-
48
-
49
-
50
-
51
-
52
-
53
-
54
-
55
-
56
 |
 |

30
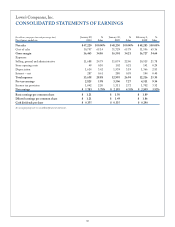
Lowe’s Companies, Inc.
CONSOLIDATED STATEMENTS OF EARNINGS
(In millions, except per share and percentage data) January 29, % January 30, % February 1, %
Fiscal years ended on 2010 Sales 2009 Sales 2008 Sales
Net sales $ 47,220 100.00% $ 48,230 100.00% $ 48,283 100.00%
Cost of sales 30,757 65.14 31,729 65.79 31,556 65.36
Gross margin 16,463 34.86 16,501 34.21 16,727 34.64
Expenses:
Selling, general and administrative 11,688 24.75 11,074 22.96 10,515 21.78
Store opening costs 49 0.10 102 0.21 141 0.29
Depreciation 1,614 3.42 1,539 3.19 1,366 2.83
Interest – net 287 0.61 280 0.58 194 0.40
Total expenses 13,638 28.88 12,995 26.94 12,216 25.30
Pre-tax earnings 2,825 5.98 3,506 7.27 4,511 9.34
Income tax provision 1,042 2.20 1,311 2.72 1,702 3.52
Net earnings $ 1,783 3.78% $ 2,195 4.55% $ 2,809 5.82%
Basic earnings per common share $ 1.21 $ 1.50 $ 1.89
Diluted earnings per common share $ 1.21 $ 1.49 $ 1.86
Cash dividends per share $ 0.355 $ 0.335 $ 0.290
See accompanying notes to consolidated financial statements.