Lowe's 2009 Annual Report Download - page 51
Download and view the complete annual report
Please find page 51 of the 2009 Lowe's annual report below. You can navigate through the pages in the report by either clicking on the pages listed below, or by using the keyword search tool below to find specific information within the annual report.-
 1
1 -
2
-
3
-
4
-
5
-
6
-
7
-
8
-
9
-
10
-
11
-
12
-
13
-
14
-
15
-
16
-
17
-
18
-
19
-
20
-
21
-
22
-
23
-
24
-
25
-
26
-
27
-
28
-
29
-
30
-
31
-
32
-
33
-
34
-
35
-
36
-
37
-
38
-
39
-
40
-
 41
41 -
 42
42 -
 43
43 -
 44
44 -
 45
45 -
 46
46 -
 47
47 -
 48
48 -
 49
49 -
 50
50 -
 51
51 -
 52
52 -
 53
53 -
 54
54 -
 55
55 -
 56
56
 |
 |

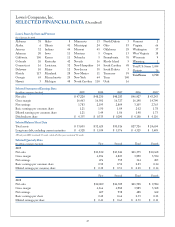
49
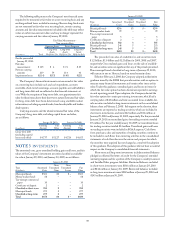
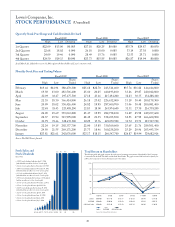
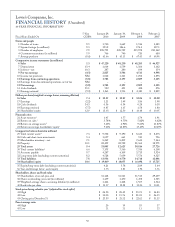
Earnings Statements
(In millions, except per share data) Fiscal 2009 Fiscal 2008
Quarter Ended Fourth ird Second First Fourth ird Second First
Net sales $10,168 $11,375 $13,844 $11,832 $ 9,984 $11,728 $14,509 $12,009
Gross margin 3,554 3,890 4,823 4,196 3,368 3,985 4,982 4,166
Expenses:
SG&A 2,763 2,872 3,109 2,944 2,610 2,726 3,014 2,725
Store opening costs 12 10 14 13 32 31 21 18
Depreciation 401 403 408 401 397 385 381 375
Interest – net 56 77 76 78 70 65 69 76
Total expenses 3,232 3,362 3,607 3,436 3,109 3,207 3,485 3,194
Pre-tax earnings 322 528 1,216 760 259 778 1,497 972
Income tax provision 117 184 457 284 97 290 559 365
Net earnings 205 344 759 476 162 488 938 607
Basic earnings per common share 0.14 0.23 0.51 0.32 0.11 0.33 0.64 0.42
Diluted earnings per
common
share
$
0.14
$ 0.23 $ 0.51 $ 0.32
$ 0.11 $ 0.33 $ 0.63 $ 0.41
Earnings Statement Changes
(Changes from same quarter previous year, to nearest tenth percent)
Fiscal 2009 Fiscal 2008
Quarter Ended Fourth ird Second First Fourth ird Second First
Net sales 1.8% (3.0)% (4.6)% (1.5)% (3.8)% 1.4% 2.4% (1.3)%
Gross margin 5.5 (2.4) (3.2) 0.7 (7.0) 0.5 2.0 (2.2)
Expenses:
SG&A 5.9 5.4 3.1 8.0 4.9 8.9 6.2 1.5
Store opening costs (63.7) (66.8) (32.5) (25.9) (47.9) (23.5) (21.0) 47.2
Depreciation 1.2 4.6 7.0 6.8 7.1 13.5 14.7 16.2
Interest – net (19.7) 17.6 10.6 2.4 50.4 30.0 37.1 61.3
Total expenses 4.0 4.8 3.5 7.6 4.8 9.3 7.3 4.1
Pre-tax earnings 24.2 (32.1) (18.8) (21.9) (60.4) (24.5) (8.4) (18.4)
Income tax provision 20.4 (36.4) (18.3) (22.2) (60.5) (25.4) (9.2) (19.4)
Net earnings 26.4 (29.6) (19.0) (21.7) (60.3) (24.0) (8.0) (17.8)
Basic earnings per common share 27.3 (30.0) (19.8) (22.4) (60.7) (25.0) (5.9) (14.3)
Diluted earnings per
common
share 27.3% (30.3)% (19.1)% (21.5)% (60.7)% (23.3)% (6.0)% (14.6)%
Earnings Statement Percentages
(Percent of sales to nearest hundredth;
income tax is percent of pre-tax earnings)
Fiscal 2009 Fiscal 2008
Quarter Ended Fourth ird Second First Fourth ird Second First
Net sales 100.00% 100.00% 100.00% 100.00% 100.00% 100.00% 100.00% 100.00%
Gross margin 34.95 34.20 34.84 35.46 33.73 33.98 34.34 34.69
Expenses:
SG&A 27.18 25.25 22.45 24.88 26.15 23.23 20.78 22.69
Store opening costs 0.11 0.09 0.10 0.11 0.32 0.27 0.14 0.15
Depreciation 3.95 3.54 2.95 3.39 3.97 3.29 2.63 3.12
Interest – net 0.55 0.68 0.55 0.66 0.70 0.56 0.47 0.63
Total expenses 31.79 29.56 26.05 29.04 31.14 27.35 24.02 26.59
Pre-tax earnings 3.16 4.64 8.79 6.42 2.59 6.63 10.32 8.10
Income tax provision 36.23 34.86 37.60 37.38 37.35 37.21 37.39 37.55
Net earnings
2.02% 3.02% 5.48% 4.02%
1.62% 4.16% 6.46% 5.06%
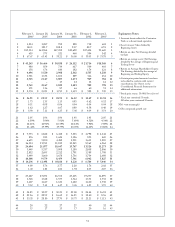
Lowe’s Companies, Inc.
QUARTERLY REVIEW OF PERFORMANCE (Unaudited)