Lowe's 2009 Annual Report Download - page 44
Download and view the complete annual report
Please find page 44 of the 2009 Lowe's annual report below. You can navigate through the pages in the report by either clicking on the pages listed below, or by using the keyword search tool below to find specific information within the annual report.-
 1
1 -
2
-
3
-
4
-
5
-
6
-
7
-
8
-
9
-
10
-
11
-
12
-
13
-
14
-
15
-
16
-
17
-
18
-
19
-
20
-
21
-
22
-
23
-
24
-
25
-
26
-
27
-
28
-
29
-
30
-
31
-
32
-
33
-
 34
34 -
 35
35 -
 36
36 -
 37
37 -
 38
38 -
 39
39 -
 40
40 -
 41
41 -
 42
42 -
 43
43 -
 44
44 -
 45
45 -
 46
46 -
 47
47 -
 48
48 -
 49
49 -
 50
50 -
 51
51 -
 52
52 -
 53
53 -
 54
54 -
55
-
56
 |
 |

42
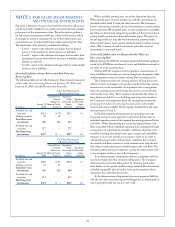
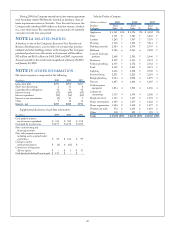
e fair value of each option grant is estimated on the date of grant
using the Black-Scholes option-pricing model. When determining
expected volatility, the Company considers the historical performance
of the Company’s stock, as well as implied volatility. e risk-free
interest rate is based on the U.S. Treasury yield curve in effect at the
time of grant, based on the options’ expected term. e expected term
of the options is based on the Company’s evaluation of option holders’
exercise patterns and represents the period of time that options are
expected to remain unexercised. e Company uses historical data to
estimate the timing and amount of forfeitures. e assumptions used
in the Black-Scholes option-pricing model for options granted in the
three years ended January 29, 2010, January 30, 2009 and February 1,
2008 are as follows:
2009 2008 2007
Assumptions used:
Expected volatility 36.4%-38.6% 25.0%-32.2% 22.6%-23.7%
Weighted-average
expected volatility 36.4% 25.1% 23.7%
Expected dividend yield 0.82%-0.97% 0.56%-0.74% 0.37%-0.49%
Weighted-average
dividend yield 0.82% 0.56% 0.37%
Risk-free interest rate 1.70%-2.08% 2.19%-3.09% 3.91%-4.57%
Weighted-average risk-free
interest rate 1.71% 2.19% 4.52%
Expected term, in years 4 4 4
Weighted-average expected
term, in years 4 4 4
e weighted-average grant-date fair value per share of options
granted was $4.58, $5.25 and $8.18 in 2009, 2008 and 2007, respectively.
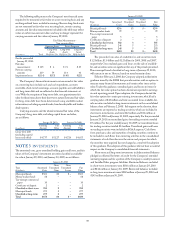
e total intrinsic value of options exercised, representing the difference
between the exercise price and the market price on the date of exercise,
was approximately $8 million, $17 million and $42 million in 2009,
2008 and 2007, respectively.
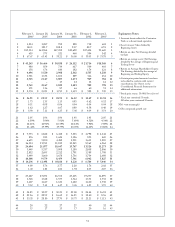
Transactions related to stock options issued under the 2006, 2001,
1997, 1994 and Directors’ plans for the year ended January 29, 2010
are summarized as follows:
Weighted-
Weighted- Average Aggregate
Average Remaining Intrinsic
Shares Exercise Price Term Value
(In thousands) Per Share (In years) (In thousands)
1
Outstanding at
January 30, 2009 25,161 $27.26
Granted 5,036 15.94
Canceled, forfeited
or expired (4,268) 23.25
Exercised (2,759) 19.88
Outstanding at
January 29, 2010 23,170 26.42 3.48 $29,697
Vested and expected
to vest at
January 29, 2010
2 23,068 26.46 3.47 29,174
Exercisable at
January 29, 2010 15,616 $29.84 2.43 $1,360
1 Options for which the exercise price exceeded the closing market price of a share of the Company’s
common stock at January 29, 2010 are excluded from the calculation of aggregate intrinsic value.
2 Includes outstanding vested options as well as outstanding, nonvested options after a forfeiture
rate is applied.
Performance Accelerated Restricted Stock Awards
PARS are valued at the market price of a share of the Company’s
common stock on the date of grant. In general, these awards vest at the
end of a five-year service period from the date of grant, unless performance
acceleration goals are achieved, in which case, awards vest 50% at the
end of three years or 100% at the end of four years. e performance
acceleration goals are based on targeted Company average return on
beginning noncash assets, as defined in the PARS agreement. PARS
are expensed on a straight-line basis over the shorter of the explicit
service period related to the service condition or the implicit service
period related to the performance conditions, based on the probability
of meeting the conditions. e Company uses historical data to estimate
the timing and amount of forfeitures. No PARS were granted in 2009,
2008 or 2007. No PARS vested in 2009 or 2007. e total fair value
of PARS vested was approximately $6 million in 2008. At January 29,
2010, there were 1.1 million nonvested PARS with a weighted-
average grant-date fair value of $32.91 outstanding, that were issued
under the 2006 and 2001 plans.
Performance-Based Restricted Stock Awards
Performance-based restricted stock awards are valued at the market
price of a share of the Company’s common stock on the date of grant.
In general, 25% to 100% of the awards vest at the end of a three-year
service period from the date of grant based upon the achievement of a
threshold and target performance goal specified in the performance-based
restricted stock agreement. e performance goal is based on targeted
Company average return on noncash assets, as defined in the performance-
based restricted stock agreement. ese awards are expensed on a
straight-line basis over the requisite service period, based on the probability
of achieving the performance goal. If the performance goal is not met,
no compensation cost is recognized and any recognized compensation
cost is reversed. e Company uses historical data to estimate the timing
and amount of forfeitures. No performance-based restricted stock awards
were granted in 2009. e weighted-average grant-date fair value per
share of performance-based restricted stock awards granted was
$23.97 and $32.18 in 2008 and 2007, respectively. During 2008, the
Company amended all 2007 performance-based restricted stock
agreements, modifying the performance goal to a prorated scale. No
performance-based restricted stock awards vested in 2009, 2008 or
2007. At January 29, 2010, there were 1.5 million performance-based
restricted stock awards with a weighted average grant-date fair value
of $27.30 outstanding, that were issued under the 2006 plan.
Restricted Stock Awards
Restricted stock awards are valued at the market price of a share of the
Company’s common stock on the date of grant. In general, these awards
vest at the end of a three- to five-year period from the date of grant and
are expensed on a straight-line basis over that period, which is considered
to be the requisite service period. e Company uses historical data
to estimate the timing and amount of forfeitures. e weighted-
average grant-date fair value per share of restricted stock awards granted
was $16.03, $23.75 and $31.23 in 2009, 2008 and 2007, respectively.
e total fair value of restricted stock awards vested was approxi-
mately $12 million, $18 million and $17 million in 2009, 2008 and
2007, respectively.