Lowe's 2009 Annual Report Download - page 52
Download and view the complete annual report
Please find page 52 of the 2009 Lowe's annual report below. You can navigate through the pages in the report by either clicking on the pages listed below, or by using the keyword search tool below to find specific information within the annual report.-
 1
1 -
2
-
3
-
4
-
5
-
6
-
7
-
8
-
9
-
10
-
11
-
12
-
13
-
14
-
15
-
16
-
17
-
18
-
19
-
20
-
21
-
22
-
23
-
24
-
25
-
26
-
27
-
28
-
29
-
30
-
31
-
32
-
33
-
34
-
35
-
36
-
37
-
38
-
39
-
40
-
41
-
 42
42 -
 43
43 -
 44
44 -
 45
45 -
 46
46 -
 47
47 -
 48
48 -
 49
49 -
 50
50 -
 51
51 -
 52
52 -
 53
53 -
 54
54 -
 55
55 -
 56
56
 |
 |

50
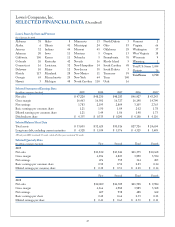
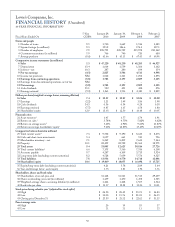
Lowe’s Companies, Inc.
FINANCIAL HISTORY (Unaudited)
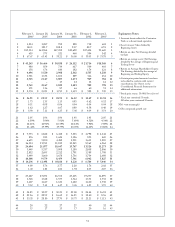
10YEAR FINANCIAL INFORMATION
1
5-Year January 29, January 30, February 1, February 2,
Fiscal Years Ended On CGR% 2010 2009 2008 2007
Stores and people
1 Number of stores 9.5 1,710 1,649 1,534 1,385
2 Square footage (in millions) 9.3 193.2 186.6 174.1 157.1
3 Number of employees 7.9 238,793 228,729 215,978 210,142
4 Customer transactions (in millions) 5.9 766 740 720 680
5 Average purchase (0.6) $ 61.66 $ 65.15 $ 67.05 $ 68.98
Comparative income statements (in millions)
6 Sales 5.3 $ 47,220 $ 48,230 $ 48,283 $ 46,927
7 Depreciation 13.4 1,614 1,539 1,366 1,162
8 Interest – net 10.3 287 280 194 154
9 Pre-tax earnings (4.3) 2,825 3,506 4,511 4,998
10 Income tax provision NM 1.042 1,311 1,702 1,893
11 Earnings from continuing operations (3.8) 1,783 2,195 2,809 3,105
12 Earnings from discontinued operations, net of tax NM – – – –
13 Net earnings (3.8) 1,783 2,195 2,809 3,105
14 Cash dividends 35.1 522 491 428 276
15 Earnings retained (9.3) $ 1,261 $ 1,704 $ 2,381 $ 2,829
Dollars per share (weighted-average shares, assuming dilution)
16 Sales 7.4 $ 32.25 $ 32.85 $ 32.04 $ 30.00
17 Earnings (2.2) 1.21 1.49 1.86 1.98
18 Cash dividends 34.3 0.36 0.34 0.28 0.18
19 Earnings retained (7.7) 0.85 1.15 1.58 1.80
20 Shareholders’ equity 12.9 $ 13.03 $ 12.30 $ 10.68 $ 10.05
Financial ratios
21 Asset turnover
2 1.45 1.57 1.74 1.91
22 Return on sales
3 3.78% 4.55% 5.82% 6.62%
23 Return on average assets
4 5.43% 6.92% 9.60% 11.87%
24 Return on
average
shareholders’ equity
5
9.61%
12.85%
17.65% 20.69%
Comparative balance sheets (in millions)
25 Total current assets 6 7.3 $ 9,732 $ 9,190 $ 8,633 $ 8,273
26 Cash and short-term investments 5.4 1,057 661 530 796
27 Merchandise inventory – net 7.1 8,249 8,209 7,611 7,144
28 Property 10.1 22,499 22,722 21,361 18,971
29 Total assets 9.4 33,005 32,625 30,816 27,726
30 Total current liabilities 6 6.6 7,355 7,560 7,316 6,108
31 Accounts payable 9.7 4,287 4,109 3,713 3,524
32 Long-term debt (excluding current maturities) 8.2 4,528 5,039 5,576 4,325
33 Total liabilities 7.8 13,936 14,570 14,718 12,001
34 Shareholders’ equity
10.6
$ 19,069 $ 18,055 $ 16,098 $ 15,725
35 Equity/long-term debt (excluding current maturities) 4.21 3.58 2.89 3.64
36 Year-end leverage factor: assets/equity 1.73 1.81 1.92 1.76
Shareholders, shares and book value
37 Shareholders of record, year-end 31,168 31,561 31,513 29,439
38 Shares outstanding, year-end (in millions) 1,459 1,470 1,458 1,525
39 Weighted-average shares, assuming dilution (in millions) 1,464 1,468 1,507 1,564
40 Book value per share $ 13.07 $ 12.28 $ 11.04 $ 10.31
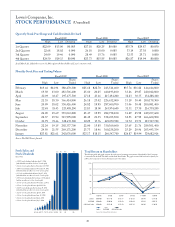
Stock price during calendar year 7 (adjusted for stock splits)
41 High $ 24.50 $ 28.49 $ 35.74 $ 34.83
42 Low $ 13.00 $ 15.76 $ 21.01 $ 26.15
43 Closing price December 31 $ 23.39 $ 21.52 $ 22.62 $ 31.15
Price/earnings ratio
44 High 20 19 19 17
45 Low 11 11 11 13