Microsoft 2005 Annual Report Download - page 23
Download and view the complete annual report
Please find page 23 of the 2005 Microsoft annual report below. You can navigate through the pages in the report by either clicking on the pages listed below, or by using the keyword search tool below to find specific information within the annual report.-
 1
1 -
2
-
3
-
4
-
5
-
6
-
7
-
8
-
9
-
10
-
11
-
12
-
 13
13 -
 14
14 -
 15
15 -
 16
16 -
 17
17 -
 18
18 -
 19
19 -
 20
20 -
 21
21 -
 22
22 -
 23
23 -
 24
24 -
 25
25 -
 26
26 -
 27
27 -
 28
28 -
 29
29 -
 30
30 -
 31
31 -
 32
32 -
 33
33 -
34
-
35
-
36
-
37
-
38
-
39
-
40
-
41
-
42
-
43
-
44
-
45
-
46
-
47
-
48
-
49
-
50
-
51
-
52
-
53
-
54
-
55
-
56
-
57
-
58
-
59
-
60
-
61
-
62
-
63
-
64
-
65
-
66
-
67
-
68
-
69
 |
 |

MANAGEMENT’S DISCUSSION AND ANALYSIS OF
FINANCIAL CONDITION AND RESULTS OF OPERATIONS (CONTINUED)
PAGE 22
Additionally, recent surveys of chief information officers also reflect slight downward revisions in expected corporate IT spend
budgets and short-term purchase intent.
As open source software development and distribution evolves, we continue to seek to differentiate our products from
competitive products based on open source software. We believe that Microsoft’s share of server unit operating systems held
steady in fiscal year 2005, while Linux distributions rose slightly faster on an absolute basis.
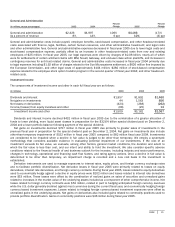
Summary
(In millions, except percentages) 2003 2004
Percent
Change 2005
Percent
Change
Revenue
$
32,187
$
36,835
14% $
39,788
8%
Operating income
$
9,545
$
9,034
(5)%
$
14,561
61%
Our revenue growth for fiscal year 2005 was driven by growth in licensing of Windows Server™ operating systems and other
server applications, licensing of Windows® Client operating systems through OEMs, and increased licensing of Office and other
Information Worker products. The license revenue growth resulted from growth in server hardware and PC shipments,
fluctuations in foreign currency exchange rates, and overall improvements in IT spending. The November 2004 launch of the
“Halo 2®” Xbox game also contributed to the overall revenue growth for the company. Based on our preliminary estimates,
worldwide PC shipments from all sources grew about 11% to 13% and total server hardware shipments grew approximately 13%
to 14% during fiscal year 2005 as compared to fiscal year 2004. The net impact of foreign exchange rates on revenue was
positive in 2005, primarily due to relative strengthening of most foreign currencies, particularly the euro and Japanese yen,
against the U.S. dollar. Had the exchange rates from the previous year been in effect in fiscal year 2005, translated
international revenue growth earned in local currencies would have been approximately $873 million or two percentage points
lower for fiscal year 2005. We hedge a portion of our international currency exposures, thereby reducing our overall exposure.
Fluctuations in foreign currency exchange rates have a greater impact on non-OEM commercial and retail license business as a
significant portion of those product revenues are denominated in foreign currencies. The vast majority of OEM license revenue
is denominated in U.S. dollars. Partially offsetting revenue growth rates was a $1.1 billion decline in earned revenue from
Upgrade Advantage in fiscal year 2005. The Upgrade Advantage contract value reached its expiration dates in the first quarter
of fiscal year 2005. This revenue was recognized over fiscal year 2003 and fiscal year 2004 and in the first quarter of fiscal
year 2005 when the contract period expired.
Revenue growth in fiscal year 2004 was primarily driven by the growth in licensing of Windows Client operating systems
through OEMs, Windows Server operating systems, Office and other server applications as a result of growth in PC and server
hardware shipments. The worldwide PC shipment growth rate from all sources was estimated at 13% and the Windows server
shipment was estimated at 18% in fiscal year 2004 as compared to fiscal year 2003. The net impact of foreign exchange rates
on revenue was positive in fiscal year 2004 due to a relative strengthening of most foreign currencies versus the U.S. dollar.
This resulted in approximately $1.10 billion growth in total revenue. Revenue growth in fiscal year 2003 was driven primarily by
multi-year licensing that occurred before the Licensing 6.0 transition date in the first quarter of fiscal year 2003. The fiscal year
2003 revenue growth also reflected a $933 million or 13% increase associated with OEM licensing of Windows operating
systems and a $309 million or 23% increase in revenue from Xbox video game consoles.
For fiscal year 2005, the operating income increase was driven by a decline in stock-based compensation expense;
increased revenue in Server and Tools, Client and Information Worker, which have higher gross margins as compared to other
segments; and a reduction in legal costs associated with major litigation. In addition, strong sales of Halo 2 reduced the overall
operating loss for the Home and Entertainment segment for fiscal year 2005. The $3.29 billion decrease in stock-based
compensation expense was partially offset by increased operating expenses of $562 million related to increased salary and
benefits for new and existing headcount. General and administrative expenses related to major litigation declined in fiscal year
2005 due to the $2.53 billion of charges related to the settlement of Sun Microsystems litigation and the fine imposed by the
European Commission in fiscal year 2004. This effect was partially offset by legal expenses of $2.08 billion related to
settlements with IBM, Novell, Gateway, and end-user class action plaintiffs to resolve antitrust issues and other matters. In
fiscal year 2004, the operating income decline was caused primarily by $2.53 billion of legal charges and $2.21 billion of stock-
based compensation expense related to our employee stock option transfer program, mainly offset by an increase in revenue. In
fiscal year 2003, the growth in operating income reflected an increase in revenue, partially offset by an increase in operating
expenses related to employee and related costs associated with headcount and increased legal settlement expenses, primarily
the Time Warner settlement charge of $750 million.