Microsoft 2005 Annual Report Download - page 30
Download and view the complete annual report
Please find page 30 of the 2005 Microsoft annual report below. You can navigate through the pages in the report by either clicking on the pages listed below, or by using the keyword search tool below to find specific information within the annual report.-
 1
1 -
2
-
3
-
4
-
5
-
6
-
7
-
8
-
9
-
10
-
11
-
12
-
13
-
14
-
15
-
16
-
17
-
18
-
19
-
 20
20 -
 21
21 -
 22
22 -
 23
23 -
 24
24 -
 25
25 -
 26
26 -
 27
27 -
 28
28 -
 29
29 -
 30
30 -
 31
31 -
 32
32 -
 33
33 -
 34
34 -
 35
35 -
 36
36 -
 37
37 -
 38
38 -
 39
39 -
 40
40 -
41
-
42
-
43
-
44
-
45
-
46
-
47
-
48
-
49
-
50
-
51
-
52
-
53
-
54
-
55
-
56
-
57
-
58
-
59
-
60
-
61
-
62
-
63
-
64
-
65
-
66
-
67
-
68
-
69
 |
 |

PAGE 29
systems. Growth is also anticipated due to a strong focus on increasing segment share in the connected device space by
working with our partners to bring to market a strong portfolio of Smartphone and mobile computing devices. In addition, we are
focused on bringing to market applications and services on the Windows Mobile platform that fulfill our customers desire for
personalized communication devices. Effective July 1, 2005, functions related to MapPoint in Mobile and Embedded Devices
have been moved to MSN. This reorganization will result in a corresponding change to the Mobile and Embedded Devices and
MSN reported results.
Home and Entertainment
(In millions, except percentages) 2003 2004
Percen
t
Change 2005
Percent
Change
Revenue $
2,748
$
2,876
5% $3,242
13%
Operating loss $(1,191)
$(1,220)
(2)% $ (391)
68%
Home and Entertainment includes the Microsoft Xbox video game console system, PC games, the Home Products Division
(HPD), and TV platform products for the interactive television industry. The success of video game consoles is determined by
console functionality, the portfolio of video game content for the console, and the market share of the console. Revenue and
unit volumes have grown quickly since we entered the market in 2002 and we have established ourselves as one of the market
leaders. We believe our competitive position and revenue is bolstered by our increasing software game attach rates, which
provides higher margins to offset the declining prices on consoles sold. Xbox consoles have negative gross margins.
Home and Entertainment revenue increased in fiscal year 2005 primarily due to significant new product launches, which
resulted in a $416 million or 23% increase in Xbox revenue. In the second quarter of fiscal year 2005, we introduced Halo 2,
which generated over $300 million in revenue in the fiscal year. Revenue from consumer hardware and software, PC games,
and TV platforms declined $50 million or 5% compared to fiscal year 2004 due to lower PC games software sales. In fiscal year
2004, Xbox revenue increased $144 million or 9% with $269 million related to higher Xbox software volumes and $117 million
due to higher Xbox console volumes, partially offset by a $242 million decline related to price reductions of Xbox consoles and
software. Overall, Xbox console volumes sales increased 11% in fiscal year 2004 compared to fiscal year 2003. Revenue from
consumer hardware and software, PC games and TV platforms declined $16 million or 1% compared to fiscal year 2003 due to
lower PC games software and PC gaming devices sales, partially offset by the new release of Mac Office.
Home and Entertainment operating loss in fiscal year 2005 decreased primarily due to an increase in high margin Xbox
software sales, lower Xbox console unit costs, the lower-of-cost-or-market inventory adjustment recorded in fiscal year 2004,
and a decrease in stock-based compensation expense. The decrease was partially offset by an increase in costs associated with
Xbox 360 console development and launch efforts associated with it. The increase in operating loss in fiscal year 2004 was
primarily due to $141 million of stock-based compensation expense from the employee stock option transfer program in the
second quarter of fiscal year 2004, increased sales of negative margin consoles, and costs associated with Xbox 360 console
development efforts, partially offset by increased Xbox and Mac Office software sales. The operating loss increase from fiscal
year 2003 also included a lower-of-cost-or-market adjustment of approximately $90 million related to Xbox console inventory.
We expect operating expenses to continue to increase as we near the launch of Xbox 360. As a result of launch-related
activities, we expect our operating loss to increase in fiscal year 2006. In fiscal year 2006, we expect Xbox console unit volumes
and revenue to increase from fiscal year 2005 due to launch of the Xbox 360. In fiscal year 2006 we expect PC games revenue
to increase from fiscal year 2005 driven by more new game titles.
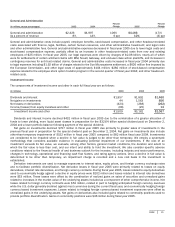
Corporate-Level Expenses
(In millions, except percentages) 2003 2004
Percen
t
Change 2005
Percent
Change
Corporate-level expenses $3,775 $6,781
80% $5,822
(14)%
Certain corporate-level expenses are not allocated to our segments. Those expenses primarily include corporate operations
related to broad-based sales and marketing, product support services, human resources, legal, finance, information technology,
corporate development and procurement activities, certain research and development and other costs, and all litigation
settlements and accrued legal contingencies.
In fiscal year 2005, corporate-level expenses decreased primarily as a result of a reduction in stock-based compensation
expense and decreased corporate legal costs. Fiscal year 2005 legal costs were $2.08 billion as compared to $2.53 billion in
fiscal year 2004. The legal costs in both years were primarily related to antitrust and competition law claims brought by
competitors, class actions on behalf of end users, and by government regulatory bodies outside the United States.