Microsoft 2005 Annual Report Download - page 35
Download and view the complete annual report
Please find page 35 of the 2005 Microsoft annual report below. You can navigate through the pages in the report by either clicking on the pages listed below, or by using the keyword search tool below to find specific information within the annual report.-
 1
1 -
2
-
3
-
4
-
5
-
6
-
7
-
8
-
9
-
10
-
11
-
12
-
13
-
14
-
15
-
16
-
17
-
18
-
19
-
20
-
21
-
22
-
23
-
24
-
 25
25 -
 26
26 -
 27
27 -
 28
28 -
 29
29 -
 30
30 -
 31
31 -
 32
32 -
 33
33 -
 34
34 -
 35
35 -
 36
36 -
 37
37 -
 38
38 -
 39
39 -
 40
40 -
 41
41 -
 42
42 -
 43
43 -
 44
44 -
 45
45 -
46
-
47
-
48
-
49
-
50
-
51
-
52
-
53
-
54
-
55
-
56
-
57
-
58
-
59
-
60
-
61
-
62
-
63
-
64
-
65
-
66
-
67
-
68
-
69
 |
 |

MANAGEMENT’S DISCUSSION AND ANALYSIS OF
FINANCIAL CONDITION AND RESULTS OF OPERATIONS (CONTINUED)
PAGE 34
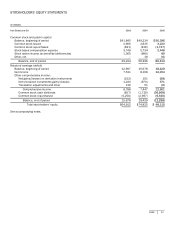
In fiscal year 2005, our Board of Directors approved $3.40 per share cash dividends, with $3.32 paid as of June 30, 2005. A
quarterly dividend of $0.08 per share (or approximately $857 million) was approved by our Board of Directors on June 15, 2005
to be paid to shareholders of record as of August 17, 2005 on September 8, 2005.
On July 20, 2004, our Board of Directors approved a plan to buy back up to $30 billion in Microsoft common stock over four
years. The specific timing and amount of repurchases will vary based on market conditions, securities law limitations, and other
factors. The repurchases will be made using our cash resources. The repurchase program may be suspended or discontinued at
any time without previous notice. In any period, cash used in financing activities related to common stock repurchased may
differ from the comparable change in stockholders’ equity, reflecting timing differences between the recognition of share
repurchase transactions and their settlement for cash. During fiscal year 2005, we repurchased 312 million shares, or $8.0
billion of our common stock under this plan.
We believe existing cash and short-term investments, together with funds generated from operations should be sufficient to
meet operating requirements, quarterly dividends and planned share repurchases. Our philosophy regarding the maintenance
of a balance sheet with a large component of cash and short-term investments, and equity and other investments, reflects our
views on potential future capital requirements relating to research and development, creation and expansion of sales
distribution channels, investments and acquisitions, share dilution management, legal risks, and challenges to our business
model. We regularly assess our investment management approach in view of our current and potential future needs.
Off-Balance Sheet Arrangements and Contractual Obligations
Off-Balance Sheet Arrangements
As of June 30, 2004, we had guaranteed the repayment of certain Japanese yen denominated bank loans and related interest
and fees of Jupiter Telecommunication, Ltd., a Japanese cable company. The total amount of these guarantees was
approximately $51 million. Effective December 21, 2004, the guarantees were terminated.
We provide indemnifications of varying scope and amount to certain customers against claims of intellectual property
infringement made by third parties arising from the use of our products. We evaluate estimated losses for such indemnifications
under SFAS No. 5, Accounting for Contingencies, as interpreted by FASB Interpretation No. (FIN) 45. We consider factors such
as the degree of probability of an unfavorable outcome and the ability to make a reasonable estimate of the amount of loss. To
date, we have not encountered material costs as a result of such obligations and have not accrued any liabilities related to such
indemnifications in our financial statements.
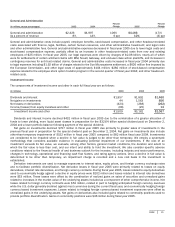
Contractual Obligations
The following table summarizes our outstanding contractual obligations as of June 30, 2005:
(In millions)(1)
Payments due by period
Fiscal Years 2006 2007-2009 2010-2012
2013 and
t
hereafter Total
Long-
t
erm debt $
–
$
–
$
– $ –
$
–
Construction commitments(2) 122
28
2 –
152
Lease obligations:
Capital leases 6
17
11 –
34
Operating leases(3) 230
493
214 96
1,033
Purchase commitments(4) 1,072
1
– –
1,073
Other long-
t
erm liabilities(5) –
95
17 12
124
Total contractual obligations $1,430 $634 $244 $108 $2,416
(1) We have excluded the $1.1 billion contingent liability related to the antitrust and unfair competition class action lawsuits
referred to in the third paragraph of Note 17 – Contingencies of the Notes to Financial Statements as the timing and
amount to be resolved in cash versus vouchers is subject to uncertainty.
(2) We have certain commitments for the construction of buildings. We expect to fund these commitments with existing cash
and cash flows from operations.
(3) Our future minimum rental commitments under noncancellable leases comprise the majority of the operating lease
obligations presented above. We expect to fund these commitments with existing cash and cash flows from operations.
(4) Purchase commitments represent obligations under agreements which are not unilaterally cancelable by us, are legally
enforceable, and specify fixed or minimum amounts or quantities of goods or services at fixed or minimum prices. We
generally require purchase orders for vendor and third-party spending. The amount presented above as purchase