Microsoft 2005 Annual Report Download - page 34
Download and view the complete annual report
Please find page 34 of the 2005 Microsoft annual report below. You can navigate through the pages in the report by either clicking on the pages listed below, or by using the keyword search tool below to find specific information within the annual report.-
 1
1 -
2
-
3
-
4
-
5
-
6
-
7
-
8
-
9
-
10
-
11
-
12
-
13
-
14
-
15
-
16
-
17
-
18
-
19
-
20
-
21
-
22
-
23
-
 24
24 -
 25
25 -
 26
26 -
 27
27 -
 28
28 -
 29
29 -
 30
30 -
 31
31 -
 32
32 -
 33
33 -
 34
34 -
 35
35 -
 36
36 -
 37
37 -
 38
38 -
 39
39 -
 40
40 -
 41
41 -
 42
42 -
 43
43 -
 44
44 -
45
-
46
-
47
-
48
-
49
-
50
-
51
-
52
-
53
-
54
-
55
-
56
-
57
-
58
-
59
-
60
-
61
-
62
-
63
-
64
-
65
-
66
-
67
-
68
-
69
 |
 |

PAGE 33
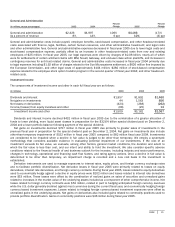
The following table outlines the expected recognition of unearned revenue at June 30, 2005:
(In millions) Recognition
o
f
Unearned Revenue
Three months ended:
September 30, 2005 $2,724
December 31, 2005 2,208
March 31, 2006 1,612
June 30, 2006 958
Thereafter 1,665
Unearned revenue $9,167
Cash Flows
Cash flow from operations for fiscal year 2005 increased 14% to $16.61 billion due primarily to an increase in cash receipts
from customers driven by our 8% revenue growth combined with a 12% increase in unearned revenue. Cash payments in fiscal
year 2005 resulting from significant legal settlements were approximately $1.8 billion lower than in the previous year, adding to
the overall increase in operating cash flow. Partially offsetting these factors were increased payments to employees resulting
from a 7% increase in full-time employees. Cash used for financing was $41.08 billion in fiscal year 2005, driven by $36.11
billion of cash dividends paid in fiscal year 2005 compared to $1.73 billion paid in fiscal year 2004. The increase was also
partially driven by $8.0 billion in cash used for common stock repurchases, an increase of $4.67 billion in cash used for share
repurchases compared to the previous year, reflecting 312 million shares repurchased in fiscal year 2005, an increase of 188.5
million shares compared to the previous year. Net cash from investing was $15.03 billion in fiscal year 2005, an increase of
$18.37 billion from fiscal year 2004, primarily due to a $23.59 billion increase in investment maturities that occurred to fund
cash dividends paid in fiscal year 2005, partially offset by a $5.32 billion decrease in cash from combined investment purchase
and sale activity.
Cash flow from operations for fiscal year 2004 decreased $1.17 billion to $14.63 billion. The decrease primarily reflects the
combined cash outflows of $2.56 billion related to the Sun Microsystems settlement and the European Commission fine
partially offset by increased cash receipts from customers driven by the rise in revenue billings. Cash used for financing was
$2.36 billion in fiscal year 2004, a decrease of $2.86 billion from the previous year. The decrease reflects that we did not
repurchase common stock in the fourth quarter of fiscal year 2004 combined with a $628 million increase primarily from stock
issuances related to employee stock options exercises, partially offset by an $872 million increase in cash dividends paid. We
repurchased 123.7 million shares of common stock under our share repurchase program in fiscal year 2004. Cash used for
investing was $3.34 billion in fiscal year 2004, a decrease of $3.88 billion from fiscal year 2003.
Cash flow from operations was $15.80 billion for fiscal year 2003, an increase of $1.29 billion from fiscal year 2002. The
increase primarily reflects the rise in cash receipts from customers driven by the increase in revenue billings and maintenance
of relatively stable accounts receivable levels. Cash used for financing was $5.22 billion in fiscal year 2003, an increase of
$651 million from the previous year. The increase reflects a cash dividend payment of $857 million in 2003 and an increase of
$417 million in common stock repurchased, offsetting $623 million received from common stock issued. We repurchased
238.2 million shares of common stock under our share repurchase program in fiscal year 2003. Cash used for investing was
$7.50 billion in fiscal year 2003, a decrease of $3.37 billion from fiscal year 2002, due to stronger portfolio performance on
sold and matured investments.
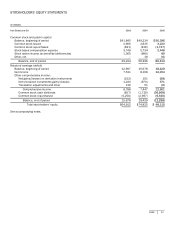
We have no material long-term debt. Stockholders’ equity at June 30, 2005 was $48.12 billion. We will continue to invest in
sales, marketing, product support infrastructure, and existing and advanced areas of technology. Additions to property and
equipment will continue, including new facilities and computer systems for research and development, sales and marketing,
support, and administrative staff. Commitments for constructing new buildings were $152 million on June 30, 2005. We have
operating leases for most U.S. and international sales and support offices and certain equipment under which we incurred
rental expense totaling, $290 million, $331 million and $299 million in fiscal year 2003, 2004 and 2005, respectively. We have
issued residual value guarantees in connection with various operating leases. These guarantees provide that if we do not
purchase the leased property from the lessor at the end of the lease term, then we are liable to the lessor for an amount equal
to the shortage (if any) between the proceeds from the sale of the property and an agreed value. As of June 30, 2005, the
maximum amount of the residual value guarantees was approximately $271 million. We believe that proceeds from the sale of
properties under operating leases would exceed the payment obligation and therefore no liability currently exists. We have not
engaged in any related party transactions or arrangements with unconsolidated entities or other persons that are reasonably
likely to materially affect liquidity or the availability of requirements for capital resources.