Microsoft 2005 Annual Report Download - page 31
Download and view the complete annual report
Please find page 31 of the 2005 Microsoft annual report below. You can navigate through the pages in the report by either clicking on the pages listed below, or by using the keyword search tool below to find specific information within the annual report.-
 1
1 -
2
-
3
-
4
-
5
-
6
-
7
-
8
-
9
-
10
-
11
-
12
-
13
-
14
-
15
-
16
-
17
-
18
-
19
-
20
-
 21
21 -
 22
22 -
 23
23 -
 24
24 -
 25
25 -
 26
26 -
 27
27 -
 28
28 -
 29
29 -
 30
30 -
 31
31 -
 32
32 -
 33
33 -
 34
34 -
 35
35 -
 36
36 -
 37
37 -
 38
38 -
 39
39 -
 40
40 -
 41
41 -
42
-
43
-
44
-
45
-
46
-
47
-
48
-
49
-
50
-
51
-
52
-
53
-
54
-
55
-
56
-
57
-
58
-
59
-
60
-
61
-
62
-
63
-
64
-
65
-
66
-
67
-
68
-
69
 |
 |

MANAGEMENT’S DISCUSSION AND ANALYSIS OF
FINANCIAL CONDITION AND RESULTS OF OPERATIONS (CONTINUED)
PAGE 30
In fiscal year 2004, corporate-level expenses increased primarily due to legal costs including a $1.92 billion charge for a
settlement with the Sun Microsystems, Inc., and the fine of €497 million ($605 million) imposed by the European Commission.
In addition, stock-based compensation increased by $497 million as compared to fiscal year 2003.
Cost of Revenue
(In millions, except percentages) 2003 2004
Percent
Change 2005 Percent
Change
Cost of revenue $6,059 $6,716
11%
$6,200 (8)%
As a percent of revenue 19%
18%
(1)
ppt
16% (2)
ppt
Cost of revenue includes manufacturing and distribution costs for products sold and programs licensed, operating costs related
to product support service centers and product distribution centers, costs incurred to support and maintain Internet-based
products and services, and costs associated with the delivery of consulting services. In addition to a decrease in the cost of
revenue in fiscal year 2005 due to lower stock-based compensation expense, the cost of revenue decreased due to a $140
million reduction in costs primarily associated with provisioning the MSN Internet Access business as subscriptions declined
and a $169 million reduction in other product costs mainly due to Xbox consoles cost efficiency in Home and Entertainment,
partially offset by increased costs in product support and consulting services costs. The increase in fiscal year 2004 was
primarily due to increased product support and consulting services costs of $508 million, $214 million of stock-based
compensation expense from the employee stock option transfer program, and a lower-of-cost-or-market inventory adjustment in
the fourth quarter of fiscal year 2004 of approximately $90 million related to the Xbox console, partially offset by a $365 million
decrease in MSN online operations costs.
Research and Development
(In millions, except percentages) 2003
2004
Percent
Change
2005 Percent
Change
Research and
development $6,595 $7,779
18%
$6,184 (21)%
As a percent of revenue
21%
21%
0
ppt
16%
(5)
ppt
Research and development expenses include payroll, employee benefits, stock-based compensation, and other headcount-
related costs associated with product development. Research and development expenses also include third-party development
and programming costs, localization costs incurred to translate software for international markets, and the amortization of
purchased software code and services content. Our research and development expenses decreased in fiscal year 2005 due to
lower stock-based compensation expense. This expense decline was partially offset by an increase in headcount-related costs
associated with incremental hiring and product development costs associated with upcoming products, primarily the Xbox 360
console and related games, SQL Server 2005, Windows Vista, and product development in Mobile and Embedded devices. The
increase in fiscal year 2004 was primarily due to $1.31 billion of stock-based compensation expenses related to the option
transfer program and other headcount-related payroll and other employee costs associated with a 3% increase in research and
development headcount from fiscal year 2003.
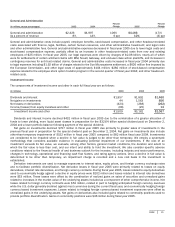
Sales and Marketing
(In millions, except percentages) 2003 2004
Percen
t
Change 2005
Percent
Change
Sales and marketin
g
$7,562
$8,309
10%
$8,677
4%
As a percent of revenue
24%
23%
(1)
pp
t
22%
(1)
ppt
Sales and marketing expenses include payroll, employee benefits, stock-based compensation, and other headcount-related
costs associated with sales and marketing personnel and advertising, promotions, tradeshows, seminars, and other marketing-
related programs. For fiscal year 2005, sales and marketing expense increased slightly due to $470 million higher headcount-
related costs from hiring and salary increases; higher sales and marketing costs driven by product planning, reseller marketing,
and advertising campaign costs mainly related to launch of the “Start Something” campaign; launch of Halo 2; and launch
arrangements for Xbox 360. The increase was offset mainly by reductions in stock-based compensation expense. Sales and
marketing costs increased in fiscal year 2004 due to $400 million of stock-based compensation expense related to the option
transfer program and other headcount-related costs related to a 9% increase in sales and marketing headcount.