Microsoft 2005 Annual Report Download - page 49
Download and view the complete annual report
Please find page 49 of the 2005 Microsoft annual report below. You can navigate through the pages in the report by either clicking on the pages listed below, or by using the keyword search tool below to find specific information within the annual report.-
 1
1 -
2
-
3
-
4
-
5
-
6
-
7
-
8
-
9
-
10
-
11
-
12
-
13
-
14
-
15
-
16
-
17
-
18
-
19
-
20
-
21
-
22
-
23
-
24
-
25
-
26
-
27
-
28
-
29
-
30
-
31
-
32
-
33
-
34
-
35
-
36
-
37
-
38
-
 39
39 -
 40
40 -
 41
41 -
 42
42 -
 43
43 -
 44
44 -
 45
45 -
 46
46 -
 47
47 -
 48
48 -
 49
49 -
 50
50 -
 51
51 -
 52
52 -
 53
53 -
 54
54 -
 55
55 -
 56
56 -
 57
57 -
 58
58 -
 59
59 -
60
-
61
-
62
-
63
-
64
-
65
-
66
-
67
-
68
-
69
 |
 |

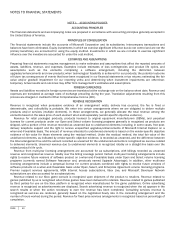
NOTES TO FINANCIAL STATEMENTS (CONTINUED)
PAGE 48
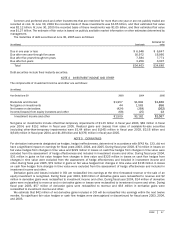
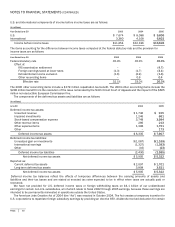
NOTE 6 INVENTORIES
(In millions)
June 30
2004 2005
Finished goods $271
$422
Raw materials and work in process 150
69
Inventories $421
$491
We recorded lower of cost or market adjustments totaling approximately $90 million in fiscal year 2004.
NOTE 7 PROPERTY AND EQUIPMENT
(In millions)
June 30
2004 2005
Land
$
274 $
313
Buildings and improvements
1,981 2,014
Leasehold improvements
805 851
Computer equipment and software
2,637 2,318
Furniture and equipment
792 879
Property and equipment, at cost
6,489 6,375
Accumulated depreciation
(4,163) (4,029)
Property and equipment, net $
2,326 $
2,346
Property and equipment are stated at cost. Depreciation is computed principally on the straight-line method over the estimated
useful lives of the assets. The useful lives for buildings range from five to fifteen years, leasehold improvements range from two
years to ten years – representing the applicable lease terms plus reasonably assured extensions, computer equipment and
software range from two to three years, and furniture and equipment range from one to five years. Land is not depreciated.
During fiscal years 2003, 2004, and 2005, depreciation expense was $929 million, $647 million, and $723 million, the
majority of which related to computer equipment.
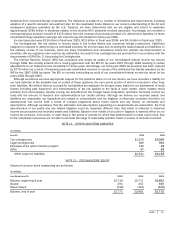
NOTE 8 GOODWILL
Changes in the carrying amount of goodwill for fiscal years 2004 and 2005 by segment, are as follows:
(In millions)
Balance as
of June 30,
2003
Acquisitions
/ purchase
accountin
g
adjustments
Divestitures
Balance as
of June 30,
2004
Acquisitions
/ purchase
accountin
g
adjustments Divestitures
Balance as
of June 30,
2005
Clien
t
$ 37 $
–
$
–
$
37 $ 6 $
–
$
43
Server and Tools 106 –
–
106
135
–
241
Information Worker 180 (2)
–
178
47 –
225
Microsoft Business
Solutions 2,219 7
(19)
2,207 3 –
2,210
MSN 154 –
–
154
17 –
171
Mobile and Embedded
Devices 28 2
–
30 – –
30
Home and Entertainment 404 (1)
–
403
– (14)
389
Total $3,128 $
6
$(19)
$3,115 $208 $(14) $3,309
We test goodwill for impairment annually during the first quarter of each fiscal year at the reporting unit level using a fair value
approach, in accordance with the provisions of SFAS No. 142, Goodwill and Other Intangible Assets. Our annual testing resulted
in no impairment charges to goodwill in fiscal years 2004 and 2005. If an event occurs or circumstances change that would
more likely than not reduce the fair value of a reporting unit below its carrying value, goodwill will be evaluated for impairment
between annual tests. During fiscal years 2004 and 2005, we had no material acquisitions.