Microsoft 2005 Annual Report Download - page 54
Download and view the complete annual report
Please find page 54 of the 2005 Microsoft annual report below. You can navigate through the pages in the report by either clicking on the pages listed below, or by using the keyword search tool below to find specific information within the annual report.-
 1
1 -
2
-
3
-
4
-
5
-
6
-
7
-
8
-
9
-
10
-
11
-
12
-
13
-
14
-
15
-
16
-
17
-
18
-
19
-
20
-
21
-
22
-
23
-
24
-
25
-
26
-
27
-
28
-
29
-
30
-
31
-
32
-
33
-
34
-
35
-
36
-
37
-
38
-
39
-
40
-
41
-
42
-
43
-
 44
44 -
 45
45 -
 46
46 -
 47
47 -
 48
48 -
 49
49 -
 50
50 -
 51
51 -
 52
52 -
 53
53 -
 54
54 -
 55
55 -
 56
56 -
 57
57 -
 58
58 -
 59
59 -
 60
60 -
 61
61 -
 62
62 -
 63
63 -
 64
64 -
65
-
66
-
67
-
68
-
69
 |
 |

PAGE 53
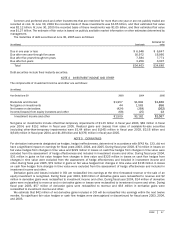
NOTE 13 OTHER COMPREHENSIVE INCOME
The activity in other comprehensive income and related tax effects are as follows:
(In millions)
Y
ear Ended June 30
2003
2004
2005
Net gains/(losses) on derivative instruments:
Unrealized gains/(losses), net of tax effect of $(69) in 2003, $49 in
2004 and $(63) in 2005 $ (129) $ 92 $(116)
Reclassification adjustment for losses included in net income, net
of tax effect of $15 in 2003, $5 in 2004 and $31 in 2005
27
9 58
Net gains/(losses) on derivative instruments
(102)
101
(58)
Net unrealized investment gains/(losses):
Unrealized holding gains/(losses), net of tax effect of $610 in
2003, $(994) in 2004 and $(69) in 2005 1,132
(1,846) (128)
Reclassification adjustment for losses included in net income, net
of tax effect of $60 in 2003, $524 in 2004 and $269 in 2005
111
973 499
Net unrealized investment gains/(losses)
1,243
(873)
371
Translation adjustments and other
116
51
(6)
Other comprehensive income /(loss) $
1,257 $ (721) $
307
The components of accumulated other comprehensive income were:
(In millions)
2004
2005
Y
ear Ended June 30
Net gains on derivative instruments $ 85
$
27
Net unrealized investment gains 973
1,344
Translation adjustments and other 61
55
Accumulated other comprehensive income $
1,119
$
1,426
NOTE 14 EMPLOYEE STOCK AND SAVINGS PLANS
Effective July 1, 2003, we adopted the fair value recognition provisions of SFAS No. 123, Accounting for Stock-Based
Compensation, using the retroactive restatement method described in SFAS No. 148, Accounting for Stock-Based
Compensation – Transition and Disclosure. Under the fair value recognition provisions of SFAS No. 123, stock-based
compensation cost is measured at the grant date based on the value of the award and is recognized as expense over the
vesting period. In connection with the use of the retroactive restatement method, income statement amounts were restated for
fiscal year 2003 to reflect results as if the fair-value method of SFAS No. 123 had been applied from its original effective date.
Total compensation cost recognized in income for stock-based employee compensation awards was $3.75 billion in fiscal year
2003, $5.73 billion in fiscal year 2004, and $2.45 billion in fiscal year 2005. The amounts for fiscal year 2004 include $2.21
billion ($1.48 billion after-tax or $0.14 per diluted share) due to the completion of the employee stock option transfer program.
Employee Stock Purchase Plan. We have an employee stock purchase plan for all eligible employees. The administrative
committee under the plan approved a change to the common stock purchase discount and approved the elimination of the
related look back period and a change to quarterly purchase periods that became effective July 1, 2005. As a result, beginning
in fiscal year 2005, shares of our common stock may presently be purchased by employees at three months intervals at 90% of
the fair market value on the last day of each three month period. Employees may purchase shares having a value not exceeding
15% of their gross compensation during an offering period. During fiscal year 2005 employees purchased 16.4 million shares at
an average price of $23.33 per share. At June 30, 2005, 159.1 million shares were reserved for future issuance.
Under the plan in effect previous to fiscal year 2005, shares of our common stock could be purchased at six month intervals
at 85% of the lower of the fair market value on the first or the last day of each six month period. Employees could purchase
shares having a value not exceeding 15% of their gross compensation during an offering period. During fiscal year 2003 and
2004 employees purchased 15.2 million and 16.7 million shares at average prices of $22.56, and $22.74 per share.