Microsoft 2005 Annual Report Download - page 33
Download and view the complete annual report
Please find page 33 of the 2005 Microsoft annual report below. You can navigate through the pages in the report by either clicking on the pages listed below, or by using the keyword search tool below to find specific information within the annual report.-
 1
1 -
2
-
3
-
4
-
5
-
6
-
7
-
8
-
9
-
10
-
11
-
12
-
13
-
14
-
15
-
16
-
17
-
18
-
19
-
20
-
21
-
22
-
 23
23 -
 24
24 -
 25
25 -
 26
26 -
 27
27 -
 28
28 -
 29
29 -
 30
30 -
 31
31 -
 32
32 -
 33
33 -
 34
34 -
 35
35 -
 36
36 -
 37
37 -
 38
38 -
 39
39 -
 40
40 -
 41
41 -
 42
42 -
 43
43 -
44
-
45
-
46
-
47
-
48
-
49
-
50
-
51
-
52
-
53
-
54
-
55
-
56
-
57
-
58
-
59
-
60
-
61
-
62
-
63
-
64
-
65
-
66
-
67
-
68
-
69
 |
 |

MANAGEMENT’S DISCUSSION AND ANALYSIS OF
FINANCIAL CONDITION AND RESULTS OF OPERATIONS (CONTINUED)
PAGE 32
In fiscal year 2004, dividends and interest income decreased by $65 million mainly due to lower dividend income resulting
from the exchange of AT&T 5% convertible preferred debt for common shares of Comcast during fiscal year 2003 and declining
interest rates, partly offset by a larger investment portfolio. Net gains on investments include other-than-temporary impairments
of $82 million in fiscal year 2004 compared to $1.15 billion in fiscal year 2003 and higher net realized gains on sales in fiscal
year 2004 as we moved to more liquid investment asset classes. Net realized gains on sales were $1.65 billion in fiscal year
2004 and $1.19 billion in fiscal year 2003. The decline in impairments was due to improved market conditions. Derivative
losses decreased $156 million to $268 million in fiscal year 2004 compared to fiscal year 2003 primarily due to the combined
effects of interest rate movements on interest rate sensitive instruments and equity market price movements relative to
positions used to hedge the fair value of certain equity securities.
Net losses on equity investees and other for the previous periods were reclassified into investment income and other to
conform to the current period presentation.
Income Taxes
Our effective tax rate for the full fiscal year 2005 was 26% compared with 33% for fiscal year 2004. The decreased rate for the
full year resulted primarily from the reversal of $776 million of previously accrued taxes upon settling an Internal Revenue
Service examination for fiscal years 1997 to 1999 and recording a tax benefit of $179 million generated by the decision to
repatriate foreign subsidiary earnings under a temporary incentive provided by the American Jobs Creation Act of 2004. The
effective tax rate for fiscal year 2003 was 32%. The fiscal year 2003 rate reflected a benefit in the second quarter of $126
million which resulted from the reversal of previously accrued taxes that were related to a previous unfavorable Tax Court ruling,
portions of which were reversed in 2003 by the Ninth Circuit Court of Appeals.
Financial Condition
Cash and short-term investments totaled $37.75 billion as of June 30, 2005 compared to $60.59 billion as of June 30, 2004.
The decline is primarily attributable to the special dividend of $3.00 per share, or $32.64 billion, paid on December 2, 2004,
and to common stock repurchases of 312 million shares for $8.0 billion during 2005. Equity and other investments were
$11.00 billion as of June 30, 2005 compared to $12.21 billion as of June 30, 2004. The investment portfolio consists primarily
of fixed-income securities, diversified among industries and individual issuers. Our investments are generally liquid and
investment grade. The portfolio is invested predominantly in U.S. dollar denominated securities, but also includes foreign
currency denominated positions in order to diversify financial risk. The portfolio is primarily invested in short-term securities to
facilitate rapid deployment for immediate cash needs. As a result of the special dividend and shares repurchased, our retained
deficit, including accumulated other comprehensive income, was $12.30 billion at June 30, 2005. Our retained deficit is not
expected to impact our future ability to operate or pay dividends given our continuing profitability and strong cash and financial
position.
Unearned Revenue
Unearned revenue is attributable to volume licensing programs, undelivered elements of software licensing arrangements, and
certain other services. Unearned revenue from volume licensing programs represents customer billings, paid either upfront or at
the beginning of each billing coverage period, that are accounted for as subscriptions with revenue recognized ratably over the
billing coverage period. For certain other licensing arrangements revenue attributable to undelivered elements, including free
post-delivery telephone support and the right to receive unspecified upgrades/enhancements of Microsoft Internet Explorer on a
when-and-if-available basis, is based on the sales price of those elements when sold separately and is recognized ratably on a
straight-line basis over the related product’s life cycle. Other unearned revenue includes Services, TV Platform, Microsoft
Business Solutions, and advertising and subscription services where we have been paid upfront and earn the revenue when we
provide the service or software or otherwise meet the revenue recognition criteria.
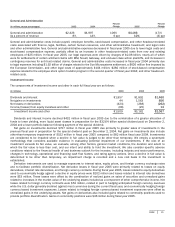
Unearned revenue as of June 30, 2005 increased $990 million from June 30, 2004 reflecting current period billings
outpacing the recognition of deferrals from multi-year licensing arrangements by $925 million and a $304 million increase
primarily in unearned revenue for services, MSN advertising and subscriptions, Xbox Live, TV platform, and Microsoft Business
Solutions, partially offset by a $239 million decline in revenue deferred for undelivered elements.