Microsoft 2005 Annual Report Download - page 39
Download and view the complete annual report
Please find page 39 of the 2005 Microsoft annual report below. You can navigate through the pages in the report by either clicking on the pages listed below, or by using the keyword search tool below to find specific information within the annual report.-
 1
1 -
2
-
3
-
4
-
5
-
6
-
7
-
8
-
9
-
10
-
11
-
12
-
13
-
14
-
15
-
16
-
17
-
18
-
19
-
20
-
21
-
22
-
23
-
24
-
25
-
26
-
27
-
28
-
 29
29 -
 30
30 -
 31
31 -
 32
32 -
 33
33 -
 34
34 -
 35
35 -
 36
36 -
 37
37 -
 38
38 -
 39
39 -
 40
40 -
 41
41 -
 42
42 -
 43
43 -
 44
44 -
 45
45 -
 46
46 -
 47
47 -
 48
48 -
 49
49 -
50
-
51
-
52
-
53
-
54
-
55
-
56
-
57
-
58
-
59
-
60
-
61
-
62
-
63
-
64
-
65
-
66
-
67
-
68
-
69
 |
 |

PAGE 38
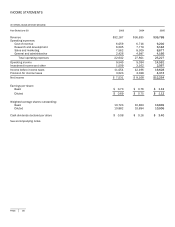
INCOME STATEMENTS
(In millions, except per share amounts)
Y
ear Ended June 30
2003 2004 2005
Revenue
$32,187 $36,835
$39,788
Operating expenses:
Cost of revenue
6,059 6,716
6,200
Research and developmen
t
6,595 7,779
6,184
Sales and marketin
g
7,562 8,309
8,677
General and administrative
2,426 4,997
4,166
Total operating expenses
22,642 27,801
25,227
Operating income
9,545 9,034
14,561
Investment income and other
1,509 3,162
2,067
Income before income taxes
11,054 12,196
16,628
Provision for income taxes
3,523 4,028
4,374
Net income
$
7,531 $ 8,168
$12,254
Earnings per share:
Basic
$
0.70 $ 0.76
$
1.13
Diluted
$
0.69 $ 0.75
$
1.12
Weighted average shares outstanding:
Basic
10,723 10,803
10,839
Diluted
10,882 10,894
10,906
Cash dividends declared per share
$
0.08 $ 0.16
$
3.40
See accompanying notes.