Microsoft 2005 Annual Report Download - page 32
Download and view the complete annual report
Please find page 32 of the 2005 Microsoft annual report below. You can navigate through the pages in the report by either clicking on the pages listed below, or by using the keyword search tool below to find specific information within the annual report.-
 1
1 -
2
-
3
-
4
-
5
-
6
-
7
-
8
-
9
-
10
-
11
-
12
-
13
-
14
-
15
-
16
-
17
-
18
-
19
-
20
-
21
-
 22
22 -
 23
23 -
 24
24 -
 25
25 -
 26
26 -
 27
27 -
 28
28 -
 29
29 -
 30
30 -
 31
31 -
 32
32 -
 33
33 -
 34
34 -
 35
35 -
 36
36 -
 37
37 -
 38
38 -
 39
39 -
 40
40 -
 41
41 -
 42
42 -
43
-
44
-
45
-
46
-
47
-
48
-
49
-
50
-
51
-
52
-
53
-
54
-
55
-
56
-
57
-
58
-
59
-
60
-
61
-
62
-
63
-
64
-
65
-
66
-
67
-
68
-
69
 |
 |

PAGE 31
General and Administrative
(In millions, except percentages) 2003 2004
Percent
Change 2005
Percent
Change
General and administrative $2,426
$4,997
106%
$4,166
(17)%
As a percent of revenue 8%
14%
6
ppt
10%
(4)
ppt
General and administrative costs include payroll, employee benefits, stock-based compensation, and other headcount-related
costs associated with finance, legal, facilities, certain human resources, and other administrative headcount; and legal costs
and other administrative fees. General and administrative expenses decreased in fiscal year 2005 due to lower legal costs and
stock-based compensation expense, partially offset by an increase in other headcount-related costs from new and existing
employees of $25 million. In fiscal year 2005, our legal expenses were driven by charges of $2.08 billion, nearly all of which
were for settlements of certain antitrust claims with IBM, Novell, Gateway, and end-user class action plaintiffs, and increases in
contingency reserves for anti-trust related claims. General and administrative costs increased in fiscal year 2004 primarily due
to legal expenses including $1.92 billion of charges related to the Sun Microsystems settlement, a $605 million fine imposed by
the European Commission, and other legal costs of approximately $104 million; $280 million of stock-based compensation
expense related to the employee stock option transfer program in the second quarter of fiscal year 2004; and other headcount-
related costs.
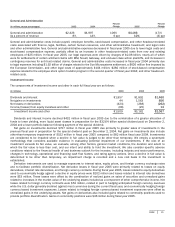
Investment Income
The components of investment income and other in each full fiscal year are as follows:
(In millions)
2003 2004 2005
Dividends and interest
$1,957
$1,892
$1,460
Net gains on investments
44
1,563
856
Net losses on derivatives
(424) (268)
(262)
Income/(losses) from equity investees and other
(68) (25)
13
Investment income and other
$1,509
$3,162
$2,067
Dividends and interest income declined $432 million in fiscal year 2005 due to the combination of a greater allocation of
funds to lower yielding, more liquid asset classes in preparation for the $32.64 billion special dividend paid on December 2,
2004 and a lower portfolio balance following payment of the special dividend.
Net gains on investments declined $707 million in fiscal year 2005 due primarily to greater sales of investments in the
previous fiscal year in preparation for the special dividend paid on December 2, 2004. Net gains on investments also include
other-than-temporary impairments of $152 million in fiscal year 2005 compared to $82 million fiscal year 2004. Investments
are considered to be impaired when a decline in fair value is judged to be other than temporary. We employ a systematic
methodology that considers available evidence in evaluating potential impairment of our investments. If the cost of an
investment exceeds its fair value, we evaluate, among other factors, general market conditions, the duration and extent to
which the fair value is less than cost, and our intent and ability to hold the investment. We also consider specific adverse
conditions related to the financial health of and business outlook for the investee, including industry and sector performance,
changes in technology, operational and financing cash flow factors, and rating agency actions. Once a decline in fair value is
determined to be other than temporary, an impairment charge is recorded and a new cost basis in the investment is
established.
Derivative instruments are used to manage exposures to interest rates, equity prices, and foreign currency exchange rates
and to facilitate portfolio diversification. Net derivative losses in fiscal year 2005 were primarily related to losses on equity
derivatives, interest rate derivatives, and foreign currency contracts. During fiscal year 2005, losses related to equity derivatives
used to economically hedge against a decline in equity prices were $202 million and losses related to interest rate derivatives
were $53 million. These losses were offset by the combination of realized gains on sales of securities and unrealized gains
related to increases in the market value of the underlying assets included as a component of other comprehensive income. Net
losses related to foreign currency contracts were $53 million, related in part to hedging anticipated foreign currency revenues
while the U.S. dollar generally declined against most currencies during the current fiscal year, and economically hedging foreign
currency based investment exposures. Losses related to hedging foreign currency-based investment exposures were offset by
unrealized gains in the underlying assets. Net gains on derivatives also included gains related to commodity positions used to
provide portfolio diversification. Gains on commodity positions were $46 million during fiscal year 2005.