Nike 2016 Annual Report Download - page 18
Download and view the complete annual report
Please find page 18 of the 2016 Nike annual report below. You can navigate through the pages in the report by either clicking on the pages listed below, or by using the keyword search tool below to find specific information within the annual report.-
 1
1 -
2
-
3
-
4
-
5
-
6
-
7
-
 8
8 -
 9
9 -
 10
10 -
 11
11 -
 12
12 -
 13
13 -
 14
14 -
 15
15 -
 16
16 -
 17
17 -
 18
18 -
 19
19 -
 20
20 -
 21
21 -
 22
22 -
 23
23 -
 24
24 -
 25
25 -
 26
26 -
 27
27 -
 28
28 -
29
-
30
-
31
-
32
-
33
-
34
-
35
-
36
-
37
-
38
-
39
-
40
-
41
-
42
-
43
-
44
-
45
-
46
-
47
-
48
-
49
-
50
-
51
-
52
-
53
-
54
-
55
-
56
-
57
-
58
-
59
-
60
-
61
-
62
-
63
-
64
-
65
-
66
-
67
-
68
-
69
-
70
-
71
-
72
-
73
-
74
-
75
-
76
-
77
-
78
-
79
-
80
-
81
-
82
-
83
-
84
-
85
 |
 |

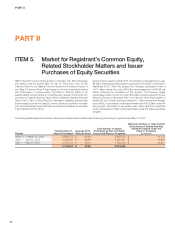
PART II
Performance Graph
The following graph demonstrates a five-year comparison of cumulative total
returns for NIKE’s Class B Common Stock, the Standard & Poor’s 500 Stock
Index, the Standard & Poor’s Apparel, Accessories & Luxury Goods Index
and the Dow Jones U.S. Footwear Index. The graph assumes an investment
of $100 on May 31, 2011 in each of our Class B Common Stock, and the
stocks comprising the Standard & Poor’s 500 Stock Index, the Standard &
Poor’s Apparel, Accessories & Luxury Goods Index and the Dow Jones U.S.
Footwear Index. Each of the indices assumes that all dividends were
reinvested on the day of issuance.
COMPARISON OF 5-YEAR CUMULATIVE TOTAL RETURN AMONG NIKE, INC.; S&P 500 INDEX; S&P APPAREL, ACCESSORIES &
LUXURY GOODS INDEX AND THE DOW JONES U.S. FOOTWEAR INDEX
$220
$200
$180
$160
$140
$120
$100
$80
$60
$40
$20
$0
2011 2012 2013 2014 2015 2016
$240
$260
$280
$300
NIKE, Inc.
S&P 500 INDEX - TOTAL RETURNS
DOW JONES US FOOTWEAR INDEX
S&P 500 APPAREL, ACCESSORIES & LUXURY GOODS INDEX
The Dow Jones U.S. Footwear Index consists of NIKE, Deckers Outdoor
Corp., Wolverine World Wide, Inc., Skechers U.S.A., Inc. and Steven
Madden, Ltd., among other companies. Because NIKE is part of the Dow
Jones U.S. Footwear Index, the price and returns of NIKE stock have a
substantial effect on this index. The Standard & Poor’s Apparel,
Accessories & Luxury Goods Index consists of V.F. Corporation, Coach, Inc.,
Ralph Lauren Corporation, Under Armour, Inc. and Michael Kors Holdings,
Limited, among other companies. The Dow Jones U.S. Footwear Index and
the Standard & Poor’s Apparel, Accessories & Luxury Goods Index include
companies in two major lines of business in which the Company competes.
The indices do not encompass all of the Company’s competitors, nor all
product categories and lines of business in which the Company is engaged.
The stock performance shown on the performance graph above is not
necessarily indicative of future performance. The Company will not make or
endorse any predictions as to future stock performance.
The performance graph above is being furnished solely to accompany this
Report pursuant to Item 201(e) of Regulation S-K, and is not being filed for
purposes of Section 18 of the Securities Exchange Act of 1934, as amended,
and is not to be incorporated by reference into any filing of the Company,
whether made before or after the date hereof, regardless of any general
incorporation language in such filing.
NIKE, INC. 2016 Annual Report and Notice of Annual Meeting 71
FORM 10-K