Nike 2016 Annual Report Download - page 21
Download and view the complete annual report
Please find page 21 of the 2016 Nike annual report below. You can navigate through the pages in the report by either clicking on the pages listed below, or by using the keyword search tool below to find specific information within the annual report.-
 1
1 -
2
-
3
-
4
-
5
-
6
-
7
-
8
-
9
-
10
-
 11
11 -
 12
12 -
 13
13 -
 14
14 -
 15
15 -
 16
16 -
 17
17 -
 18
18 -
 19
19 -
 20
20 -
 21
21 -
 22
22 -
 23
23 -
 24
24 -
 25
25 -
 26
26 -
 27
27 -
 28
28 -
 29
29 -
 30
30 -
 31
31 -
32
-
33
-
34
-
35
-
36
-
37
-
38
-
39
-
40
-
41
-
42
-
43
-
44
-
45
-
46
-
47
-
48
-
49
-
50
-
51
-
52
-
53
-
54
-
55
-
56
-
57
-
58
-
59
-
60
-
61
-
62
-
63
-
64
-
65
-
66
-
67
-
68
-
69
-
70
-
71
-
72
-
73
-
74
-
75
-
76
-
77
-
78
-
79
-
80
-
81
-
82
-
83
-
84
-
85
 |
 |
PART II
ITEM 7. Management’s Discussion and Analysis of
Financial Condition and Results of Operations
NIKE designs, develops, markets and sells athletic footwear, apparel,
equipment, accessories and services worldwide. We are the largest seller of
athletic footwear and apparel in the world. We sell our products to retail
accounts, through NIKE-owned in-line and factory retail stores and NIKE-
owned internet websites (which we refer to collectively as our “Direct to
Consumer” or “DTC” operations) and through a mix of independent
distributors, licensees and sales representatives in virtually all countries
around the world. Our goal is to deliver value to our shareholders by building a
profitable global portfolio of branded footwear, apparel, equipment and
accessories businesses. Our strategy is to achieve long-term revenue growth
by creating innovative, “must have” products, building deep personal
consumer connections with our brands and delivering compelling consumer
experiences at retail and online.
In addition to achieving long-term, sustainable revenue growth, we continue
to strive to deliver shareholder value by driving operational excellence in
several key areas:
•Expanding gross margin by:
–Delivering innovative, premium products that command higher prices
while maintaining a balanced price-to-value equation for consumers;
–Reducing product costs through a continued focus on manufacturing
efficiency, product design and innovation;
–Making our supply chain a competitive advantage by investing in new
technologies that increase automation, help reduce waste and have long-
term potential to increase both customization of our products and speed
to market; and
–Driving growth in our higher gross margin DTC business, led by
NIKE.com, as part of an integrated marketplace growth strategy across
our DTC and wholesale operations.
•Optimizing selling and administrative expense by focusing on:
–Investments in consumer engagement that drive economic returns in the
form of incremental revenue and gross profit;
–Infrastructure investments that improve the efficiency and effectiveness of
our operations; and
–Investments in key areas of future growth, including our DTC business.
•Managing working capital efficiency; and
•Deploying capital effectively.
Through execution of this strategy, our long-term financial goals through fiscal
2020, on average per year, are as follows:
•High single-digit to low-double digit revenue growth;
•Mid-teens earnings per share growth;
•High-twenties to low-thirties percentage rate of return on invested capital;
•Free cash flow growing faster than net income; and
•Sustainable, profitable, long-term growth through effective management of
our diversified portfolio of businesses.
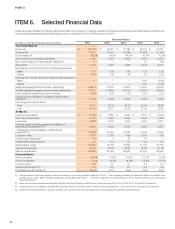
Over the past ten years, we have achieved many of our financial goals. During
this time, revenues and diluted earnings per common share for NIKE, Inc.,
inclusive of both continuing and discontinued operations, have grown 8% and
13%, respectively, on an annual compounded basis. We expanded gross
margin by approximately 220 basis points and our return on invested capital
has increased from 22.6% to 29.7%.
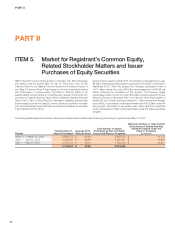
On November 19, 2015, we announced a two-for-one stock split of both
NIKE Class A and Class B Common Stock. The stock split was in the form of
a 100 percent stock dividend payable on December 23, 2015 to shareholders
of record at the close of business on December 9, 2015. Common stock
began trading at the split-adjusted price on December 24, 2015. All share and
per share amounts presented reflect the stock split.
Our fiscal 2016 results demonstrated the power of the NIKE, Inc. portfolio to
deliver continued growth and expanding profitability. Despite significant
foreign currency headwinds, we achieved record revenues and earnings per
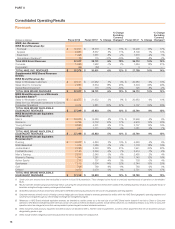
share for fiscal 2016. NIKE, Inc. Revenues grew 6% to $32.4 billion, gross
margin expanded 20 basis points, Net income increased 15% and diluted
earnings per common share grew 17% to $2.16. We also delivered strong
cash returns to shareholders while investing for long-term growth.
Earnings before interest and income taxes (“EBIT”) increased 10% for fiscal
2016, driven by revenue growth and gross margin expansion, while selling
and administrative expense was flat as a percent of revenues. The increase in
revenues was attributable to growth for nearly every NIKE Brand geography
and across most key categories and product types. This broad-based growth
was primarily fueled by:
•Innovative performance and sportswear products, incorporating proprietary
technology platforms such as NIKE Air, Free, Zoom, Lunar, Flywire, Dri-Fit
and Flyknit;
•Deep brand connections with consumers through our category offense,
reinforced by investments in endorsements by high-profile athletes, sports
teams and leagues, high-impact marketing around global sporting events
and digital marketing; and
•Strong category retail presentation online and at NIKE-owned and retail
partner stores.
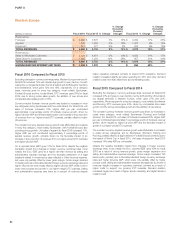
Converse revenues and EBIT decreased 1% and 6%, respectively, as growth
in direct distribution markets was more than offset by the negative impact of
changes in foreign currency exchange rates.
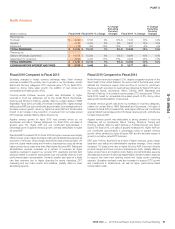
Gross margin increased primarily due to higher full-price average selling price
and the favorable impact of growth in our higher-margin DTC businesses,
partially offset by higher product costs, primarily due to shifts in mix to higher-
cost products and labor input cost inflation, higher off-price mix and
unfavorable changes in foreign currency exchange rates.
For fiscal 2016, the growth in Net income was positively affected by a year-
over-year decrease in our effective tax rate of 350 basis points primarily due to
an increase in the proportion of earnings from operations outside the United
States, which are generally subject to a lower tax rate. Diluted earnings per
common share grew at a higher rate than Net income due to a 1% decrease
in the weighted average diluted common shares outstanding, driven by our
share repurchase program.
While foreign currency markets remain volatile, we continue to see
opportunities to drive future growth and profitability, and remain committed to
effectively managing our business to achieve our financial goals over the long-
term by executing against the operational strategies outlined above.
74