Nike 2016 Annual Report Download - page 25
Download and view the complete annual report
Please find page 25 of the 2016 Nike annual report below. You can navigate through the pages in the report by either clicking on the pages listed below, or by using the keyword search tool below to find specific information within the annual report.-
 1
1 -
2
-
3
-
4
-
5
-
6
-
7
-
8
-
9
-
10
-
11
-
12
-
13
-
14
-
 15
15 -
 16
16 -
 17
17 -
 18
18 -
 19
19 -
 20
20 -
 21
21 -
 22
22 -
 23
23 -
 24
24 -
 25
25 -
 26
26 -
 27
27 -
 28
28 -
 29
29 -
 30
30 -
 31
31 -
 32
32 -
 33
33 -
 34
34 -
 35
35 -
36
-
37
-
38
-
39
-
40
-
41
-
42
-
43
-
44
-
45
-
46
-
47
-
48
-
49
-
50
-
51
-
52
-
53
-
54
-
55
-
56
-
57
-
58
-
59
-
60
-
61
-
62
-
63
-
64
-
65
-
66
-
67
-
68
-
69
-
70
-
71
-
72
-
73
-
74
-
75
-
76
-
77
-
78
-
79
-
80
-
81
-
82
-
83
-
84
-
85
 |
 |

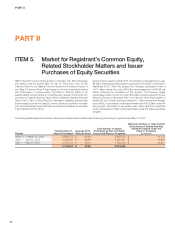
PART II
By geography, futures orders growth was as follows:
Reported Futures
Orders Futures Orders Excluding
Currency Changes(1)
North America 6% 6%
Western Europe 8% 11%
Central & Eastern Europe 3% 7%
Greater China 19% 24%
Japan 24% 15%
Emerging Markets 3% 13%
TOTAL NIKE BRAND FUTURES ORDERS 8% 11%
(1) Reported futures have been restated using prior year exchange rates for the comparative period to enhance the visibility of the underlying business trends, excluding the impact of foreign
currency exchange rate fluctuations.
The reported futures orders growth is not necessarily indicative of our
expectation of revenue growth during this period. This is due to year-over-
year changes in shipment timing, changes in the mix of orders between
futures and at-once orders, and because the fulfillment of certain orders may
fall outside of the schedule noted above. In addition, exchange rate
fluctuations as well as differing levels of order cancellations, discounts and
returns can cause differences in the comparisons between futures orders and
actual revenues. Moreover, a portion of our revenue is not derived from
futures orders, including sales of at-once and closeout NIKE Brand footwear
and apparel, all sales of NIKE Brand equipment, the difference between retail
sales and internal orders from our DTC in-line stores and e-commerce
operations, and sales from Converse, NIKE Golf and Hurley.
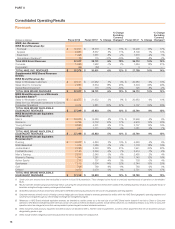
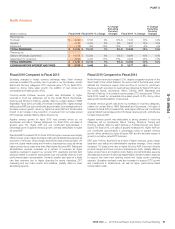
Gross Margin
(Dollars in millions) Fiscal 2016 Fiscal 2015 % Change Fiscal 2014 % Change
Gross profit $ 14,971 $ 14,067 6% $ 12,446 13%
Gross margin % 46.2% 46.0% 20 bps 44.8% 120 bps
Fiscal 2016 Compared to Fiscal 2015
For fiscal 2016, our consolidated gross margin was 20 basis points higher
than fiscal 2015, primarily attributable to the following factors:
•Higher NIKE Brand full-price ASP (increasing gross margin approximately
190 basis points) aligned with our strategy to deliver innovative, premium
products with higher prices and, to a lesser extent, due to price increases
reflecting inflationary conditions in certain territories;
•Growth in our higher-margin DTC business (increasing gross margin
approximately 20 basis points);
•Higher NIKE Brand product costs (decreasing gross margin approximately
70 basis points) as shifts in mix to higher-cost products and labor input cost
inflation were only partially offset by lower material input costs;
•Higher off-price mix (decreasing gross margin approximately 30 basis
points), primarily reflecting the impacts from clearing excess inventory in
North America;
•Unfavorable changes in foreign currency exchange rates, net of hedges
(decreasing gross margin approximately 40 basis points);
•Higher other costs (decreasing gross margin approximately 20 basis
points), primarily due to higher product design and development costs; and
•Lower gross margin from Converse (decreasing gross margin
approximately 20 basis points), primarily resulting from shifts in mix to lower-
margin products.
Fiscal 2015 Compared to Fiscal 2014
For fiscal 2015, our consolidated gross margin was 120 basis points higher
than fiscal 2014, primarily driven by the following factors:
•Higher NIKE Brand full-price ASP (increasing gross margin approximately
250 basis points) primarily attributable to shifts in mix to higher-priced
products and, to a lesser extent, price increases in response to inflationary
conditions in certain territories;
•Higher NIKE Brand product costs (decreasing gross margin approximately
190 basis points) largely due to shifts in mix to higher-cost products, labor
input cost inflation and higher air freight costs, in part to mitigate the
negative impacts from product delays due to the West Coast port
congestion in the United States;
•Growth in our higher-margin DTC business (increasing gross margin
approximately 40 basis points); and
•Changes in foreign currency exchange rates (including gains and losses on
hedge transactions) increased gross margin approximately 20 basis points.
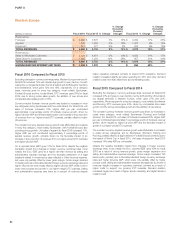
Total Selling and Administrative Expense
(Dollars in millions) Fiscal 2016 Fiscal 2015 % Change Fiscal 2014 % Change
Demand creation expense(1) $ 3,278 $ 3,213 2% $ 3,031 6%
Operating overhead expense 7,191 6,679 8% 5,735 16%
Total selling and administrative expense $ 10,469 $ 9,892 6% $ 8,766 13%
% of Revenues 32.3% 32.3% — bps 31.5% 80 bps
(1) Demand creation expense consists of advertising and promotion costs, including costs of endorsement contracts, television, digital and print advertising, brand events and retail brand
presentation.
78